


Writing a quantitative Results section can be harder than running the analysis. Many researchers have correct statistical output but struggle to present it clearly. Common problems include incorrect p-value formatting, missing confidence intervals, unclear tables, repeated results, and too much interpretation in Chapter 4.
A quantitative Results section should show what the data reveal. It should present statistical findings in a clear and logical order. It should also give readers enough information to understand and assess the analysis.
This guide explains the most common mistakes in quantitative results sections. It also covers quantitative Chapter 4 writing errors, statistical reporting mistakes, APA formatting, data presentation, and ways to separate reporting from interpretation.
💡 Ready to polish your research paper for publication?
Transform your manuscript with PaperEdit's professional editing and proofreading services!
1. Mixing Results With Discussion
One of the most common quantitative Chapter 4 writing errors is mixing results with interpretation.
What is the problem?
The Results section should tell readers what you found. The Discussion should explain what those findings mean.
For example:
Participants in the intervention group had higher posttest scores than those in the control group, M = 82.40 versus M = 75.10, t(98) = 2.84, p = .006.
This is a Results statement. It reports the finding.
A Discussion statement might say:
The higher scores may suggest that the intervention improved learning outcomes.
This statement moves into interpretation.
Why does this matter?
A clear separation helps readers follow your research. It also prevents Chapter 4 from becoming repetitive.
Common pitfall
Do not explain the wider meaning of every statistical result. Report the evidence first. Save detailed explanations, comparisons with earlier studies, and theoretical implications for the Discussion unless your university requires a different structure.
2. Reporting Only the p Value
A common statistical reporting mistake is to write:
The result was statistically significant (p < .05).
This gives readers too little information.
What should you report?
The exact details depend on the statistical test. They may include:
- Test statistic
- Degrees of freedom
- p value
- Effect size
- Confidence interval
- Mean and standard deviation
- Sample size
For example:
A Pearson correlation showed a moderate positive relationship between study time and examination scores, r(118) = .42, p < .001, 95% CI [.26, .55].
This gives readers much more information.
Why does this matter?
A p value tells readers about statistical evidence under a given hypothesis-testing framework. It does not show the size of an effect. It also does not show how precise an estimate is.
That is why good statistical reporting includes more than significance testing.
Common pitfall
Do not treat p < .05 as the main finding. Report the effect and its uncertainty when appropriate.
3. Making APA Statistical Reporting Errors
Small formatting errors can reduce the quality of a dissertation or journal manuscript.
When using APA-style reporting, check statistical symbols such as:
- M
- SD
- t
- F
- p
- r
- N
- n
Statistical symbols are commonly italicized in APA style. APA also uses a leading zero differently from ordinary decimal numbers. For example:
- Correct: p = .032
- Incorrect APA-style form: p = 0.032
What about p = .000?
Statistical software may display a significance value as .000. This does not mean the probability is exactly zero.
Report the result as:
p < .001
rather than:
p = .000
Common pitfall
Do not copy the formatting from SPSS, R, Stata, or another statistical program directly into your manuscript. Software output is not the same as publication-ready reporting.
Also read: Top 10 APA 7th Formatting Errors That Cause Journal Rejections and How to Fix Them
4. Leaving Out Confidence Intervals and Effect Sizes
Another common mistake is reporting statistical significance without reporting the size and precision of an effect.
Consider these two statements:
The treatment had a significant effect, p = .01.
and:
The treatment increased scores by 6.4 points, 95% CI [1.8, 11.0], p = .01.
The second statement gives readers more useful information.
Why are confidence intervals important?
A confidence interval shows the uncertainty around an estimate. It helps readers understand the range of values associated with the estimate.
Why are effect sizes important?
Effect sizes help readers judge the magnitude of a finding.
Depending on your analysis, you may report:
- Cohen's d
- Pearson's r
- Odds ratios
- Risk ratios
- Regression coefficients
- Standardized beta coefficients
- η² or partial η²
Common pitfall
Do not report every possible statistic simply because your software provides it. Select measures that fit your research question, analysis, discipline, and journal guidelines.
5. Repeating Tables in the Main Text
Researchers often make a simple mistake: they present a table and then repeat every number from that table in the paragraph.
This creates unnecessary repetition.
Better approach
Use the text to highlight the main pattern. Let the table provide the full numerical detail.
For example:
Table 3 shows that perceived usefulness was positively associated with adoption intention. Perceived complexity showed a weaker negative association.
The table can then provide the full coefficients, confidence intervals, and p values.
Why does this matter?
Readers should be able to scan your Results section quickly. Repeating every number makes the section longer without making it clearer.
Common pitfalls
Avoid:
- Repeating the full table in the text
- Creating tables with no clear purpose
- Presenting the same result in several formats
- Using unclear table titles
- Failing to define abbreviations
- Introducing a table without explaining its main finding
6. Copying Statistical Software Output
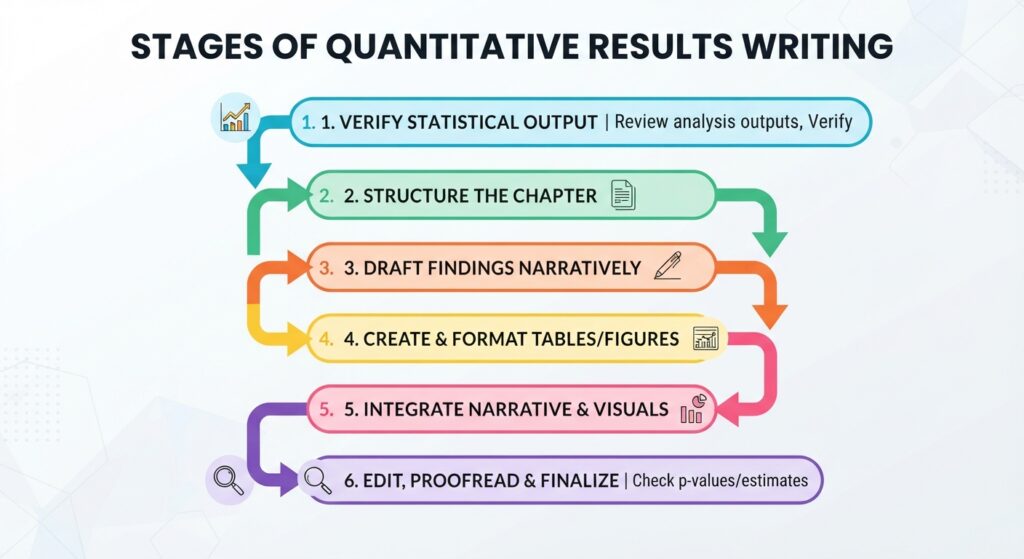
Statistical software produces detailed output. Your dissertation or research paper should not look like a software report.
What should you do?
Turn raw output into clear academic prose.
For example, software may produce:
B = .438, SE = .129, Beta = .371, t = 3.395, Sig. = .001.
A manuscript could report:
Regression analysis showed that study engagement significantly predicted examination performance, β = .37, t(146) = 3.40, p = .001.
The second version is easier to read and gives readers the information they need.
Industry-standard criterion
Follow the reporting rules for your field and target journal. Report the statistical method clearly enough for another researcher to understand what was tested.
Common pitfall
Do not assume that software output is automatically suitable for publication. Statistical analysis and statistical reporting are two different tasks.
7. Using Inconsistent Decimal Places
Inconsistent numbers can make a Results section look unfinished.
For example:
| Variable | M | SD | p |
| Group A | 72.5 | 8.12 | .03 |
| Group B | 68.42 | 9.1 | .004 |
The results may be correct, but the precision is inconsistent.
What should you check?
Review:
- Means
- Standard deviations
- Correlations
- Regression coefficients
- Test statistics
- Confidence intervals
- Percentages
- Measurement units
Use a consistent level of precision within comparable results.
Common pitfall
Do not change decimal places simply to make numbers look similar. Follow the requirements of your style guide and the precision that makes sense for the measurement.
Also read: Structuring Chapter 4: Results & Findings Explained 2026 Dissertation Guide
8. Confusing Statistical Significance With Practical Importance
A statistically significant result is not automatically an important result.
For example, a very large sample may produce a small p value for a small effect.
At the same time, a study with a small sample may fail to reach statistical significance even when the estimated effect is meaningful.
How should you report significance?
If your prespecified significance level is α = .05 and your result is p = .032, you can state that the result was statistically significant.
However, avoid statements such as:
The result was important because p = .032.
Instead, report the size and uncertainty of the effect as well.
Common pitfall
Do not use words such as “important,” “strong,” or “meaningful” based only on the p value.
Also read: Presenting Qualitative Interview Data in Tables: 2026 Author Guide
9. Reporting Percentages Without Counts
Percentages can be misleading when readers do not know the underlying sample size.
Instead of writing:
75% of participants reported improved satisfaction.
write:
75% of participants (45/60) reported improved satisfaction.
This gives readers both the percentage and the count.
Why does this matter?
A percentage based on 45 of 60 participants is different from the same percentage based on 4,500 of 6,000 participants.
Common pitfall
Check every percentage against the original data:
Percentage = numerator ÷ denominator × 100
This simple check can catch many data presentation errors.
10. Creating Tables That Are Hard to Read
A table can be statistically correct and still be poorly designed.
A strong quantitative table should have:
- A clear table number
- A concise title
- Clear column headings
- Consistent decimal places
- Defined abbreviations
- Appropriate notes
- Enough information to understand the results
Readers should not have to search through several paragraphs to understand a table.
Common pitfall
Do not paste the default output from statistical software into your manuscript.
Remove unnecessary columns. Rename unclear headings. Use the formatting required by your university or journal.
11. Failing to Check Tables, Text, and Output
One of the most serious statistical reporting mistakes is inconsistency between different parts of a study.
For example:
- The Methods section reports N = 152.
- The Results section reports N = 150.
- A regression table reports N = 148.
These numbers may have valid explanations. Missing data may have reduced the sample for a specific analysis.
However, the reason must be clear.
Use a three-way audit
Compare:
Statistical output → Tables → Narrative
Then compare all three with:
Methods → Sample → Research questions
Every major finding should be traceable through this chain.
This is one of the most effective ways to find quantitative Chapter 4 writing errors before submission.
Also read: PaperEdit Academic Proofreading Services
12. Treating Chapter 4 as a Data Dump
Chapter 4 should not be a record of everything you did in statistical software.
Organize your findings around your research questions and hypotheses.
A clear structure may include:
4.1 Introduction
Briefly explain what the chapter presents.
4.2 Data Screening
Report relevant checks for missing data, outliers, assumptions, and other issues.
4.3 Participant Characteristics
Present demographic and baseline information.
4.4 Descriptive Statistics
Report the main descriptive findings.
4.5 Inferential Statistics
Address each research question or hypothesis in a logical order.
4.6 Additional Analyses
Clearly identify secondary or exploratory analyses.
4.7 Chapter Summary
Briefly summarize the main statistical findings.
Your university may require a different structure. Always follow the official dissertation guidelines when they differ from this framework.
13. Interpreting Results Too Early
A common question is:
Should I interpret my findings in Chapter 4 or save them for Chapter 5?
The answer depends on your university or journal structure.
In many dissertations, Chapter 4 focuses on reporting the findings, while Chapter 5 contains the main interpretation and discussion.
In some fields, however, results and discussion are combined.
A useful rule
In Chapter 4, focus on:
What did the analysis show?
In Chapter 5, focus on:
What do these findings mean?
If your institution allows some interpretation in Chapter 4, keep it brief and closely tied to the reported result.
Common pitfall
Do not repeat the same explanation in both chapters. This creates unnecessary length and weakens the structure of the dissertation.
14. Making Unsupported Causal Claims
Quantitative data do not automatically prove causation.
For example, a correlation between social media use and academic performance does not, by itself, show that social media use causes changes in academic performance.
Be careful with words such as:
- Causes
- Leads to
- Produces
- Results in
- Improves
- Reduces
Use causal language only when it is supported by the study design and analysis.
Better reporting
Instead of:
Social media use causes lower academic performance.
consider:
Higher social media use was associated with lower academic performance.
The second statement reports an association without making an unsupported causal claim.
Statistical Reporting Comparison
| Analysis | Common reporting elements | Common mistake |
| Descriptive statistics | M, SD, n, percentages | Reporting only percentages |
| t test | M, SD, t, df, p, effect size where appropriate | Reporting only p |
| ANOVA | F, df, p, effect size | Omitting degrees of freedom |
| Correlation | r, p, CI where appropriate | Treating correlation as causation |
| Regression | Coefficients, SE, test statistic, p, CI | Copying software output |
| Proportions | Count, denominator, percentage | Giving percentages without counts |
The exact requirements depend on the statistical method, discipline, study design, and target journal.
How to Avoid Errors in Quantitative Results
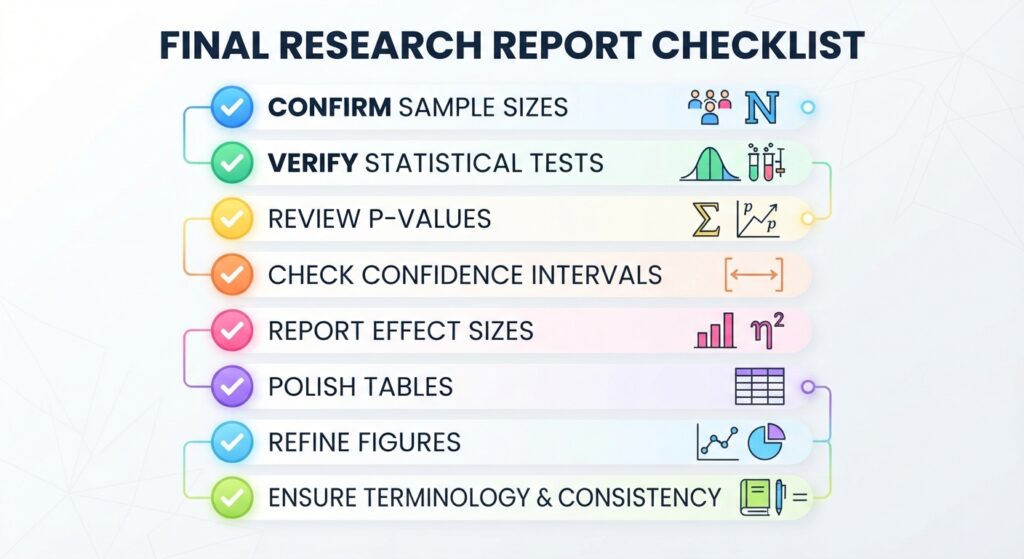
Use a four-stage editing process.
Stage 1: Check statistical accuracy
Verify:
- Sample sizes
- Degrees of freedom
- Test statistics
- p values
- Confidence intervals
- Effect sizes
- Regression coefficients
- Percentages
Stage 2: Check logical accuracy
Ask:
- Does each research question have a result?
- Is each statistical test described correctly?
- Are exploratory analyses identified?
- Are causal claims supported?
- Is interpretation separated from reporting?
Stage 3: Check formatting
Audit:
- APA 7th edition or required journal style
- Statistical symbols
- Decimal places
- Table numbers
- Figure numbers
- Table notes
- Abbreviations
- p-value formatting
For APA guidance, consult the APA Style resources and Purdue OWL's APA statistical reporting guidance.
For biomedical research, consult the ICMJE Recommendations.
Stage 4: Proofread for consistency
Read the Results section as an editor would.
Check whether:
- The order is logical.
- Important findings are easy to find.
- Tables add value.
- Text does not repeat tables.
- Statistical terms are used consistently.
- Numbers match across the manuscript.
- The language is clear and concise.
Pre-Submission Checklist for Chapter 4
Before submitting your dissertation or manuscript, confirm that:
- Every research question or hypothesis has a corresponding result.
- Sample sizes are consistent.
- Statistical tests are named correctly.
- Test statistics have been checked against the original output.
- Degrees of freedom are correct.
- p values are formatted correctly.
- p = .000 has not been reported as zero.
- Confidence intervals are included where appropriate.
- Effect sizes are reported where required.
- Percentages have corresponding counts.
- Tables and figures are numbered correctly.
- Every table and figure is discussed in the text.
- Tables do not repeat large amounts of information from the narrative.
- Decimal places are consistent.
- Units are consistent.
- Statistical significance is not confused with practical importance.
- Correlation is not presented as causation.
- Exploratory analyses are clearly identified.
- Results are not overloaded with Discussion-level interpretation.
- Statistical terminology is consistent.
- The final manuscript follows the target journal or university guidelines.
Conclusion
A strong quantitative Results section is accurate, clear, and easy to follow. It does not simply copy statistical output. It guides readers from the research question to the analysis and then to the statistical finding.
The most common errors are often easy to prevent. Check your p values. Report effect sizes and confidence intervals when appropriate. Keep tables and text consistent. Use clear statistical language. Most importantly, separate reporting from interpretation.
Before submission, complete a final statistical and language audit. Professional academic proofreading can then help identify inconsistencies that are easy to miss during your own review.
Explore PaperEdit's academic editing and proofreading services to refine your quantitative Results section and prepare your manuscript for dissertation submission or journal review.