


Chapter 4 is where a dissertation stops describing what you planned to investigate and shows what your study actually found. Structuring Chapter 4 results dissertation content effectively requires more than placing tables, interview excerpts, or statistical outputs in sequence: you must organize evidence so that readers can trace each finding back to a research question, hypothesis, or analytical objective.
A strong Results and Findings chapter presents data objectively, uses consistent reporting conventions, and separates what the analysis shows from what those findings mean. This distinction is particularly important in quantitative, qualitative, and mixed-methods dissertations, where the organization and presentation of evidence can differ substantially.
This guide explains how to write results and findings chapter content, organize quantitative and qualitative results, apply dissertation data presentation guidelines, and present research findings effectively without allowing interpretation to overwhelm the evidence.
💡 Ready to polish your research paper for publication?
Transform your manuscript with PaperEdit's professional editing and proofreading services!
What Is Chapter 4 in a Dissertation?
Chapter 4 typically presents the results or findings generated from the study's data analysis. In many dissertation structures, it follows the methodology chapter and precedes the discussion chapter.
The precise organization depends on your institution, discipline, methodology, and supervisor's requirements. Some universities combine Results and Discussion, while others require separate chapters.
The central principle remains consistent:
Chapter 4 should answer: “What did the analysis reveal?”
Chapter 5, or the Discussion section, generally addresses a different question:
“What do these findings mean in relation to the literature, theory, and research objectives?”
What belongs in Chapter 4?
Depending on your study, Chapter 4 may contain:
- Participant or sample characteristics
- Data screening and preparation
- Descriptive statistics
- Inferential statistical results
- Hypothesis-testing results
- Thematic or content-analysis findings
- Qualitative themes and subthemes
- Tables and figures
- Interview excerpts or other qualitative evidence
- Results organized according to research questions
- Findings from multiple datasets or analytical phases
Avoid turning Chapter 4 into a second methodology chapter. Briefly identify the analytical procedure when necessary for understanding a result, but do not reproduce the full methods discussion.
How to Structure Chapter 4 Results in a Dissertation
A reliable structure moves from orientation → evidence → findings → synthesis.
A typical Chapter 4 framework is:
- Chapter introduction
- Data preparation or response/sample overview
- Results organized by research question or objective
- Quantitative and/or qualitative findings
- Supplementary analyses
- Chapter summary
The exact sequence should follow your research design.
1. Start With a Brief Chapter Introduction
The opening should orient readers without repeating your entire methodology.
State:
- The purpose of the chapter
- The dataset or participants being analyzed
- The research questions addressed
- The order in which findings are presented
- Any important analytical conventions
For example:
This chapter presents the findings of the study in relation to the four research questions. The chapter first describes the characteristics of the study sample, followed by descriptive and inferential analyses. Results are then presented according to the sequence of the research questions.
Keep the introduction concise. A lengthy theoretical discussion belongs elsewhere.
2. Present Sample or Dataset Characteristics
Before reporting your principal findings, establish the analytical context.
For quantitative studies, this may include:
- Sample size (N)
- Age or demographic characteristics
- Group membership
- Missing-data patterns
- Inclusion and exclusion criteria
- Relevant descriptive statistics
For qualitative research, you might report:
- Number of participants
- Participant characteristics relevant to the study
- Interview or observation corpus
- Number and duration of interviews
- Data saturation or information power, where appropriate to the methodological approach
Do not overwhelm the reader with information that does not contribute to understanding the findings.
Organizing Quantitative and Qualitative Results
Organizing quantitative and qualitative results requires different presentation conventions, but both approaches benefit from a clear relationship between research questions and evidence.
Quantitative Results
Quantitative Chapter 4 sections commonly progress from descriptive to inferential analysis.
For example:
4.1 Chapter Introduction
4.2 Sample Characteristics
4.3 Descriptive Statistics
4.4 Research Question 1: Variable Relationships
4.5 Research Question 2: Group Differences
4.6 Research Question 3: Predictive Analysis
4.7 Hypothesis Testing Summary
4.8 Chapter Summary
Report statistics using the conventions required by your discipline and style guide.
Depending on the analysis, this may include:
- M and SD
- Median and interquartile range
- Frequencies and percentages
- Confidence intervals
- Effect sizes
- Test statistics
- Degrees of freedom
- p-values
- Regression coefficients
- Correlation coefficients
Do not report statistical significance without sufficient contextual information. A statement such as “the result was significant” is rarely adequate on its own.
Instead, identify the analysis and report the relevant statistic, effect estimate, uncertainty measure, and significance information where appropriate.
Qualitative Findings
Qualitative results require a different organizational logic.
A common structure is:
4.1 Chapter Introduction
4.2 Participant Overview
4.3 Theme 1: [Theme Name]
4.4 Theme 2: [Theme Name]
4.5 Theme 3: [Theme Name]
4.6 Cross-Theme Pattern
4.7 Chapter Summary
Each theme should do more than provide a label followed by several quotations.
A strong theme section typically contains:
- A concise explanation of the theme
- Evidence demonstrating the pattern
- Carefully selected participant quotations
- Relevant variation or contradictory cases
- A short synthesis connecting the evidence to the research question
Use quotations as evidence rather than allowing them to replace analytical writing.
Organize Results Around Research Questions
One of the most effective approaches to structuring the results section of a thesis is to use the research questions as the organizing framework.
Suppose your dissertation asks:
- RQ1: What factors influence student engagement?
- RQ2: How does engagement differ between instructional formats?
- RQ3: How do students describe their experiences of online learning?
Your Chapter 4 might therefore use:
4.3 Findings for Research Question 1
Present the analyses directly addressing RQ1.
4.4 Findings for Research Question 2
Present comparative or inferential evidence addressing RQ2.
4.5 Findings for Research Question 3
Present themes and supporting excerpts addressing RQ3.
This structure allows examiners to determine quickly whether every research question has been addressed.
Also read: Top 10 APA 7th Formatting Errors That Cause Journal Rejections and How to Fix Them
Dissertation Data Presentation Guidelines: Tables, Figures, and Text
Tables and figures should reduce cognitive load, not increase it.
Follow your university's dissertation template first, then apply the relevant disciplinary style guide.
Use tables when readers need exact values
Tables work well for:
- Descriptive statistics
- Participant characteristics
- Regression results
- Correlation matrices
- Coding summaries
- Theme frequencies, where frequency is methodologically meaningful
- Comparative results
Use figures when patterns matter more than individual values
Figures can communicate:
- Trends
- Relationships
- Distributions
- Conceptual patterns
- Analytical models
- Process relationships
Avoid duplicating the same information extensively in both a table and a figure.
Technical presentation standards
Check your institutional requirements for:
- Font type and size
- Margins
- Line spacing
- Table numbering
- Figure numbering
- Caption placement
- Page orientation
- Resolution
- Accessibility requirements
For images and figures, 300 DPI is a commonly used publication-quality benchmark, although the exact requirement depends on the journal or university.
For charts, prioritize readable axis labels, units, legends, and captions. Never make the reader infer what a figure demonstrates.
A table should stand on its own
A reader should be able to understand a table without searching several pages for essential definitions.
Include:
- Descriptive title
- Clearly labeled columns and rows
- Measurement units
- Abbreviations explained in a note
- Appropriate statistical notation
- Source information where required
Results vs. Findings: What Is the Difference?
The terms results and findings are sometimes used interchangeably, but methodological conventions differ.
“Results” is especially common in quantitative research and experimental disciplines. “Findings” is frequently used in qualitative and social-science research.
The more important distinction is between reporting evidence and interpreting its broader meaning.
| Chapter 4 reporting | Chapter 5 discussion |
| Reports observed results | Interprets their significance |
| Presents statistical outcomes | Compares findings with literature |
| Describes qualitative themes | Explains theoretical implications |
| Reports patterns in the dataset | Explores why patterns may have occurred |
| Answers research questions with evidence | Explains implications of the answers |
| Limits claims to available evidence | Develops broader interpretation |
The boundary is not absolute. Some qualitative traditions integrate interpretation into the findings chapter, and some dissertations combine Results and Discussion. Follow your approved research design and institutional requirements.
How to Present Research Findings Effectively
Presenting research findings effectively requires disciplined sequencing.
Lead with the finding
Do not force readers to interpret a table before telling them what matters.
Instead of:
Table 4.6 presents the regression analysis.
Use a more informative sentence:
The regression analysis indicated that perceived institutional support was positively associated with student retention, after controlling for age and enrollment status (Table 4.6).
Then provide the relevant statistical details.
Explain not duplicate tables
A table contains numbers. Your prose should identify the meaningful pattern.
Avoid rewriting every value from the table in paragraph form.
Report unexpected results objectively
Unexpected findings are not necessarily weaknesses.
If a hypothesis was not supported, state that clearly. Do not manipulate wording to make a nonsignificant result appear meaningful.
Similarly, qualitative findings should acknowledge negative cases, divergent experiences, or contradictory evidence when these are relevant to the analytical framework.
Maintain terminology consistency
If your variable is called “academic self-efficacy” in Chapter 1, do not alternate between:
- academic confidence
- learner confidence
- student self-belief
- academic self-efficacy
unless those terms represent deliberately distinct constructs.
Terminological inconsistency can make an otherwise rigorous dissertation appear conceptually unstable.
Also read: Complete Master’s & PhD Dissertation Defense & Formatting Checklist: 2026 Guide
Common Chapter 4 Submission Pitfalls
1. Repeating the methodology
Do not explain your complete sampling or analytical procedure again. Include only enough methodological context to make the reported result understandable.
2. Mixing results with unsupported interpretation
Statements about causes, implications, or theoretical significance generally require discussion-level analysis unless your methodology explicitly integrates interpretation into the findings.
3. Overloading the chapter with raw data
Appendices are appropriate for extensive questionnaires, coding documents, supplementary tables, statistical outputs, or other supporting material when permitted by institutional guidelines.
Chapter 4 should emphasize the evidence necessary to answer your research questions.
4. Reporting p-values without effect information
Statistical significance alone does not communicate the magnitude or practical importance of an observed effect.
Where appropriate, report effect sizes and confidence intervals alongside inferential statistics.
5. Inconsistent table formatting
Common problems include:
- Changing decimal places
- Inconsistent abbreviations
- Missing units
- Unexplained symbols
- Incorrect table numbering
- Captions that do not follow the required style
A final formatting audit should check every table and figure systematically.
6. Presenting quotations without analytical context
A participant quotation should support an analytical claim. Do not fill pages with quotations while providing minimal explanation of the pattern they represent.
7. Ignoring negative or contradictory findings
Selective reporting can undermine the credibility of the chapter. Present results transparently and explain methodological limitations rather than concealing inconvenient observations.
Also read: PaperEdit Academic Proofreading Services
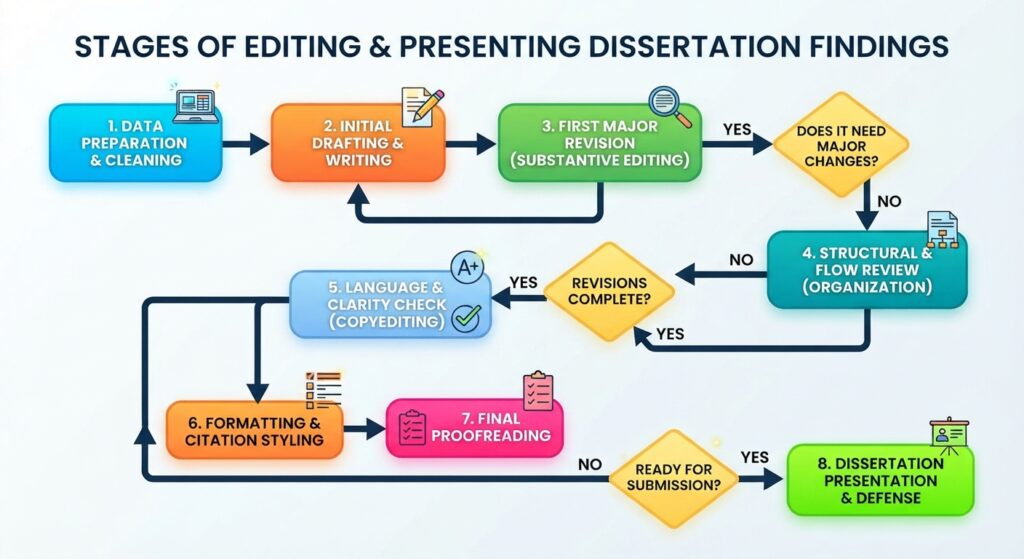
Chapter 4 Editing: What to Audit Before Submission
A dedicated editing pass should follow the substantive analysis.
Structural editing
Check whether:
- Every research question has a corresponding results section.
- Sections appear in a logical sequence.
- Headings accurately describe their contents.
- Tables and figures appear near their first discussion where required.
- Cross-references are accurate.
- The chapter summary reflects the actual findings.
Line editing and academic style
Audit for:
- Concise sentences
- Appropriate academic tone
- Consistent terminology
- Clear statistical language
- Correct tense
- Logical transitions
- Elimination of unnecessary repetition
Copyediting
Verify:
- Statistical symbols
- Italics
- Capitalization
- Abbreviations
- Numerals
- Units
- Hyphenation
- Table and figure labels
Proofreading
The final pass should identify:
- Typographical errors
- Missing words
- Duplicate words
- Incorrect cross-references
- Formatting inconsistencies
- Citation-reference mismatches
PaperEdit's manuscript editing and proofreading services can provide an additional quality-control layer before submission.
Use the Appropriate Reporting Framework
Your Results chapter should also reflect the reporting standard appropriate to your study.
For example:
- CONSORT — randomized trials
- STROBE — observational studies
- PRISMA — systematic reviews and meta-analyses
- COREQ — qualitative interviews and focus groups
- Other discipline-specific reporting standards where applicable
Check the relevant official guidance before finalizing the chapter.
For broader academic writing and formatting questions, consult the APA Style guidance or Purdue Online Writing Lab.
For biomedical manuscripts, the ICMJE Recommendations provide widely used guidance on manuscript preparation and reporting.
A Practical Chapter 4 Template
Use this framework as a starting point, then adapt it to your methodology and university requirements:
Chapter 4: Results and Findings
4.1 Introduction
- Purpose of chapter
- Research questions addressed
- Organization of findings
4.2 Data Preparation and Sample Characteristics
- Final sample
- Data screening
- Missing data
- Participant characteristics
4.3 Results for Research Question 1
- Relevant analysis
- Table/figure
- Key finding
- Supporting evidence
4.4 Results for Research Question 2
- Relevant analysis
- Table/figure
- Key finding
- Supporting evidence
4.5 Findings for Research Question 3
- Theme 1
- Theme 2
- Theme 3
- Supporting quotations
- Pattern synthesis
4.6 Additional or Supplementary Findings
- Secondary analyses
- Robustness checks
- Unexpected findings
4.7 Chapter Summary
- Concise synthesis of the principal findings
- Transition to Discussion
Chapter 4 Pre-Submission Checklist
Before uploading your dissertation, complete this final audit:
- Every research question is explicitly addressed.
- Findings are presented in a logical order.
- Results are clearly distinguished from discussion where required.
- Sample characteristics are reported accurately.
- Statistical tests include appropriate reporting details.
- Effect sizes and confidence intervals are reported where applicable.
- Qualitative themes are clearly defined and supported by evidence.
- Participant quotations are anonymized where required.
- Tables and figures are numbered sequentially.
- Every table and figure is referenced in the text.
- Captions follow university or style-guide requirements.
- Decimal places and statistical notation are consistent.
- Abbreviations are defined at first use.
- Terminology is consistent throughout the chapter.
- No major findings are buried in unnecessary prose.
- Raw or supplementary material is placed in appendices where appropriate.
- Citations and references are consistent with the required style.
- Cross-references have been checked after pagination.
- The chapter has undergone a final proofreading pass.
Conclusion
A strong Chapter 4 does not simply display data. It builds a transparent evidentiary path from research questions to analyzed results and clearly supported findings. Whether your dissertation uses statistical models, qualitative themes, or mixed-methods evidence, effective organization allows examiners to identify what was discovered, how the evidence supports each conclusion, and where the discussion should begin.
Follow your university's dissertation template and approved methodology first; then refine structure, language, tables, figures, and references through systematic academic editing.
For a final quality-control review, PaperEdit's academic editing and proofreading services can help refine clarity, consistency, formatting, and submission readiness before you upload your dissertation.