


Determining the appropriate sample size is only half the challenge in academic research. Researchers must also explain how they arrived at that number, which statistical assumptions informed the calculation, and whether the final sample provides sufficient evidence to address the research question. An incomplete sample size justification can raise concerns about methodological rigor, statistical validity, and the reproducibility of a study during peer review.
Sample size and power analysis reporting refers to the systematic description of how researchers determine the number of participants, observations, or experimental units required to detect a prespecified effect with an acceptable probability of statistical significance. A well-written justification demonstrates that the study was designed to answer its primary research question rather than relying on an arbitrary recruitment target.
For journal submission, the Methods section should identify the calculation approach, statistical assumptions, anticipated effect size, significance level, desired power, software, and final recruitment target. Researchers must also distinguish between prospective (a priori) power calculations and retrospective (post-hoc) analyses.
This guide explains how to report sample size in a research paper, write an a priori power calculation paragraph, justify limited sample sizes, document G*Power parameters, and report attrition accurately while maintaining compliance with scholarly reporting standards.
💡 Ready to polish your research paper for publication?
Transform your manuscript with PaperEdit's professional editing and proofreading services. Refine your statistical reporting, improve methodological clarity, and prepare your research for journal submission.
1. Understand What Sample Size and Statistical Power Mean
Before writing the Methods section, researchers should understand the relationship between sample size, effect size, and statistical power.
What is sample size?
Sample size refers to the number of participants, observations, experimental units, or samples included in a research study. It directly influences the precision of statistical estimates and the ability to identify meaningful differences or associations.
For example, a clinical trial comparing two treatments may require 120 participants per group, whereas a qualitative interview study may involve 15 participants selected through purposive sampling.
The appropriate sample size depends on:
- The primary research question and study objectives.
- The anticipated effect size or outcome prevalence.
- The variability of the measured outcome.
- The statistical test or analytical model.
- The significance level (alpha).
- The desired statistical power.
- Expected non-response, dropout, or missing data.
What is statistical power?
Statistical power is the probability of rejecting a false null hypothesis when a specified alternative is true. It is calculated as:
Power = 1 - β
Here, β represents the probability of a Type II error (failing to reject a false null hypothesis).
Researchers commonly select 80% or 90% power, corresponding to β values of 0.20 and 0.10, respectively. However, these are conventions rather than universal requirements. The appropriate target should reflect the research context, consequences of missing an effect, feasibility, and study design.
Four parameters that influence sample size
| Parameter | Meaning | Typical consideration |
| Significance level (α) | Probability of a Type I error | Commonly 0.05 |
| Statistical power | Probability of detecting a specified effect | Commonly 80–90% |
| Effect size | Magnitude of the anticipated difference or association | Based on prior evidence or meaningful differences |
| Sample size (n) | Number of required observations or participants | Determined by the calculation |
Increasing the anticipated effect size generally reduces the required sample size, whereas detecting smaller effects usually requires more participants. Greater variability also increases sample size requirements.
Common submission pitfall: Reporting only that the study included 100 participants without explaining why this number was considered sufficient. A defensible Methods section must explain how the target was established.
2. How to Report an A Priori Power Calculation in the Methods Section
An a priori power calculation is performed before data collection to estimate the sample size required to detect a prespecified effect.
This is generally the preferred approach for confirmatory quantitative studies because it demonstrates prospective planning rather than post-hoc justification.
Step 1: Identify the primary outcome
Specify the primary outcome variable used to determine the sample size.
For example:
- Difference in mean blood pressure between treatment groups.
- Difference in infection prevalence.
- Correlation between two continuous variables.
- Association between exposure and disease.
- Change in a clinical score over time.
If multiple outcomes are involved, identify which outcome governed the calculation and explain why.
Step 2: Specify the anticipated effect size
The effect size represents the magnitude of the difference or association researchers aim to detect.
Select an effect size using:
- Previous studies with comparable populations.
- Published systematic reviews or meta-analyses.
- Pilot study findings.
- Clinically or practically meaningful differences.
- Established theoretical expectations.
Cohen's conventional benchmarks are sometimes used for standardized effects. For example, standardized mean differences of approximately 0.2, 0.5, and 0.8 are commonly described as small, medium, and large.
However, these conventions should not replace context-specific justification. A clinically meaningful difference may be more appropriate than an arbitrary standardized threshold.
Step 3: Report the significance level and desired power
State the significance level and statistical power explicitly.
A commonly used configuration is:
- Significance level: α = 0.05.
- Statistical power: 1 − β = 0.80.
- Type II error probability: β = 0.20.
- Hypothesis testing: Two-sided.
If a one-sided test is used, explain its scientific justification. Do not select a one-sided test simply to reduce the required sample size.
Step 4: Identify the statistical test and calculation method
Specify whether the calculation was based on an independent-samples t-test, paired t-test, chi-square test, correlation analysis, regression model, survival analysis, or another appropriate method.
The calculation must match the planned study design and primary statistical analysis.
Step 5: Report the calculated sample size
Provide the required number of participants or experimental units per group and the total target sample.
For example, a two-group comparison might require 64 participants per group, producing a minimum analyzable sample of 128 participants.
If an allowance for attrition is included, explain the adjustment separately.
Common submission pitfall: Reporting 80% power and a 5% significance level without identifying the expected effect size, statistical test, or assumptions used to calculate the sample.
3. What Parameters Must Be Included in a Sample Size Power Analysis Write-Up?
A reproducible sample size justification requires sufficient information for another researcher to understand and, where possible, replicate the calculation.
The CONSORT 2025 guidance emphasizes reporting the primary outcome, target difference, statistical assumptions, sample size per group, and adjustments for anticipated losses.
Essential reporting parameters
| Parameter | Information to report |
| Primary outcome | Variable used for sample size estimation |
| Effect size | Expected difference, association, or standardized effect |
| Variability | Standard deviation or other relevant dispersion estimate |
| Significance level | Alpha value and whether testing is one- or two-sided |
| Statistical power | Target power or corresponding beta value |
| Allocation ratio | Planned distribution between study groups |
| Statistical method | Test, model, or sample size formula |
| Software | Program, version, and relevant citation |
| Attrition adjustment | Expected dropout or non-response percentage |
| Final sample | Required analyzable and recruitment sample sizes |
Additional information may be necessary for specialized designs.
For instance, cluster-randomized studies should account for the intracluster correlation coefficient (ICC), average cluster size, and design effect. Survival studies may require the expected event rate, recruitment period, follow-up duration, and number of events. Non-inferiority trials must specify the non-inferiority margin.
How to report effect size conventions
Do not simply state that a medium effect size was assumed. Identify the numerical value and its source.
For example:
"For the independent-samples comparison, a standardized mean difference (Cohen's d) of 0.50 was assumed based on findings from a previous study involving a comparable population."
This statement is more informative because it identifies both the statistical assumption and its methodological rationale.
Common submission pitfall: Using generic effect size labels without providing numerical values or supporting references.
Also read: Common Mistakes in Quantitative Results Sections
4. How to Report G*Power Parameters in the Methodology
G*Power is a widely used statistical software program for conducting power analyses across several statistical test families, including t-tests, F-tests, chi-square tests, and selected correlation and regression analyses.
When researchers use G*Power, the Methods section should identify the software version and the parameters entered into the calculation.
Important G*Power settings to document
For a typical independent-samples comparison, report:
- Test family: For example, t-tests.
- Statistical test: Means: Difference between two independent means (two groups).
- Type of power analysis: A priori calculation.
- Tail(s): One-tailed or two-tailed.
- Effect size: Cohen's d or another appropriate measure.
- Alpha error probability: Commonly 0.05.
- Power: Commonly 0.80 or 0.90.
- Allocation ratio: Equal or unequal group allocation.
- Output: Required total sample size and sample size per group.
The software citation should correspond to the version and functionality actually used.
A commonly cited reference is:
Faul, F., Erdfelder, E., Lang, A. G., & Buchner, A. (2007). G*Power 3: A flexible statistical power analysis program for the social, behavioral, and biomedical sciences. Behavior Research Methods, 39, 175-191. https://doi.org/10.3758/BF03193146
For correlation and regression analyses, researchers may also cite the 2009 G*Power 3.1 publication by Faul and colleagues.
Example G*Power reporting paragraph
"An a priori power analysis was conducted using G*Power version 3.1.9.7 (Faul et al., 2007) to estimate the required sample size for the primary comparison between two independent groups. Assuming a medium standardized effect size (Cohen's d = 0.50), a two-tailed significance level of 0.05, and statistical power of 0.80, the analysis indicated that 128 participants were required, with 64 participants allocated to each group."
Note: This is an illustrative reporting example. Researchers should replace the numerical results and software version with their actual output.
Common submission pitfall: Naming G*Power without reporting the selected test family, statistical test, effect size, alpha, power, and resulting sample size.
5. How Do You Report Post-Hoc Power Analysis Versus A Priori Power Calculation?
The distinction between prospective and retrospective power analysis is important during manuscript preparation.
A priori power calculation
An a priori calculation is performed before data collection. It estimates the sample size needed to detect a specified effect under predetermined assumptions.
It should normally appear in the Methods section of a planned confirmatory study.
Post-hoc power analysis
Post-hoc power analysis calculates statistical power after data collection, using the observed sample size and an assumed effect size.
Although researchers sometimes use it to justify an underpowered study or explain nonsignificant findings, observed post-hoc power is generally not recommended as an interpretive measure.
Post-hoc power calculated using the observed effect is largely determined by the resulting p-value and does not provide meaningful additional evidence about whether a nonsignificant result reflects the absence of an effect.
Researchers should instead report:
- The observed effect estimate.
- Confidence intervals.
- Exact p-values.
- The achieved sample size.
- Relevant limitations concerning statistical precision.
The article Post hoc Power is Not Informative (2022) provides a detailed explanation of these limitations.
Key differences
| Feature | A priori calculation | Post-hoc power analysis |
| Timing | Before data collection | After data collection |
| Main purpose | Determine required sample size | Calculate retrospective power |
| Inputs | Prespecified effect, alpha, and desired power | Observed sample size and assumed effect |
| Recommended use | Prospective study planning | Generally discouraged for interpreting completed studies |
| Methods reporting | Essential when performed | Disclose only when methodologically relevant |
| Better alternative for nonsignificant results | Not applicable | Effect estimates and confidence intervals |
Important: Never claim that a study was adequately powered simply because post-hoc power exceeded 80%. Likewise, a nonsignificant result should not automatically be interpreted as evidence of no effect.
6. How to Justify Sample Size When Research Resources Are Limited
Researchers sometimes conduct studies with limited funding, recruitment access, time, or eligible participants. In these circumstances, the sample size may be determined by feasibility rather than a conventional power target.
The key is to explain the constraint transparently and avoid presenting a convenience-based sample as statistically optimal.
Approaches for justifying a limited sample
1. Conduct a feasibility-based calculation
Estimate the number of eligible participants who can realistically be recruited during the available study period.
Document the recruitment setting, eligibility criteria, recruitment duration, and available resources.
2. Use precision-based justification
For prevalence studies and surveys, explain the desired confidence interval width and expected prevalence.
A confidence-interval-based sample size calculation may be more appropriate than a conventional hypothesis-testing power calculation.
3. Use sensitivity analysis
Determine the minimum effect detectable with the available sample size under specified statistical assumptions.
This approach helps readers understand the limitations of the study's statistical precision.
4. Consider pilot-study objectives
Pilot and feasibility studies often focus on recruitment rates, intervention acceptability, data collection procedures, or preliminary parameter estimates rather than definitive hypothesis testing.
Their sample size should be justified using feasibility objectives or an appropriate estimation framework.
Example paragraph for resource-limited studies
"The sample size was determined based on the availability of eligible participants and the recruitment capacity of the study center during the six-month data collection period. Although a larger sample would have improved statistical precision, the final target reflected the available recruitment resources. Accordingly, the study was designed as an exploratory investigation, and the findings were interpreted with consideration of the limited sample size and associated uncertainty."
Where appropriate, supplement this explanation with confidence intervals, sensitivity analyses, or a minimum detectable effect calculation.
Common submission pitfall: Claiming that a small sample was sufficient because similar studies used comparable numbers. Previous studies can inform planning, but they do not independently establish statistical adequacy.
Also read: How to Report P-Values, Effect Sizes, and Confidence Intervals in a Research Paper
7. How to Report Attrition and Final Analyzed Sample Size
The recruitment target and final analyzed sample size are not necessarily identical.
Participants may withdraw, fail to complete assessments, become ineligible, or provide incomplete data. Researchers must account for these possibilities during sample size planning and report the actual participant flow.
Calculate the adjusted recruitment target
If the required analyzable sample is 128 participants and the expected attrition rate is 15%, the adjusted recruitment target is:
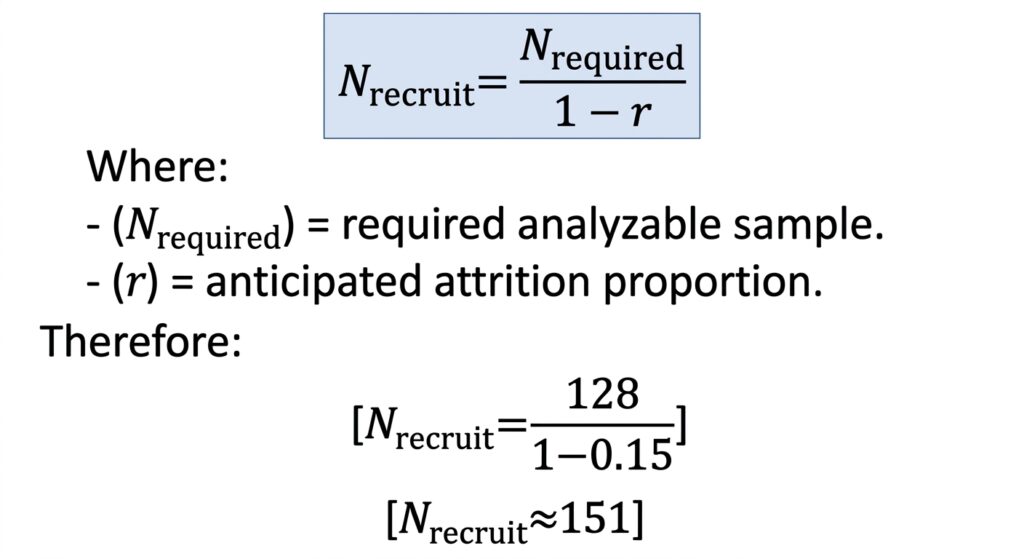
Researchers should therefore aim to recruit approximately 151 participants to retain 128 analyzable observations, assuming the expected attrition rate is accurate.
What should be reported?
Include:
- Initial recruitment target.
- Number of participants approached and enrolled.
- Number of withdrawals and exclusions.
- Reasons for participant loss.
- Final sample included in each analysis.
- Methods used to handle missing data.
Distinguish between participants recruited, randomized, retained, and included in the primary analysis.
For randomized trials, use the CONSORT participant-flow diagram where applicable. For observational studies, consult the STROBE reporting checklist.
Common submission pitfall: Reporting the initial sample size without explaining substantial differences between the recruitment target and final analyzed population.
8. Sample Size Reporting Standards Across Different Research Designs
The reporting approach should reflect the study design rather than applying the same power analysis template to every research project.
| Research design | Appropriate sample size justification | Key reporting considerations |
| Randomized controlled trials | Prospective power calculation | Target difference, alpha, power, allocation, attrition |
| Cross-sectional surveys | Precision or prevalence-based calculation | Expected prevalence, confidence level, margin of error |
| Case-control studies | Power calculation for anticipated association | Exposure prevalence, odds ratio, case-control ratio |
| Cohort studies | Event-based or hypothesis-testing calculation | Event rate, follow-up, expected effect |
| Qualitative studies | Information power or thematic adequacy | Participant selection, research aims, data richness |
| Pilot studies | Feasibility-based justification | Recruitment, retention, procedural objectives |
Qualitative and pilot studies require different reasoning
A qualitative study does not usually require a conventional statistical power calculation because its purpose is to explore experiences, perceptions, and meanings rather than test a prespecified quantitative hypothesis.
Researchers should explain how participant numbers were determined, using concepts such as information power, sampling strategy, analytical objectives, and the richness of collected data.
Similarly, pilot studies should prioritize feasibility objectives instead of claiming definitive statistical power to establish intervention effectiveness.
The justification should match the actual purpose of the research.
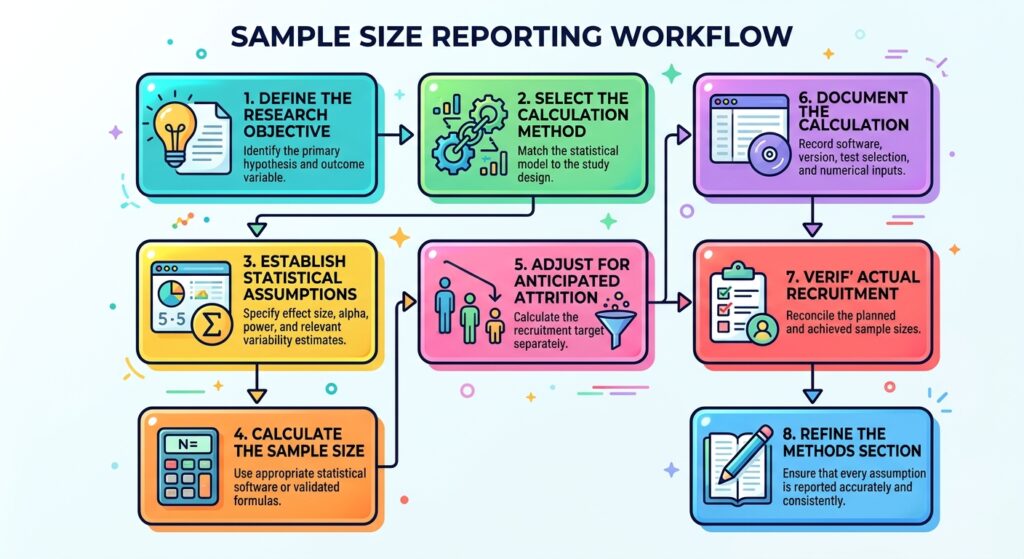
9. A Step-by-Step Manuscript Editing and Reporting Workflow
Before submitting the manuscript, audit the sample size justification against the study protocol, statistical analysis plan, actual recruitment records, and applicable reporting guidelines.
Also read: PaperEdit Academic Proofreading Services
10. Recommended Guidelines and Resources for Statistical Reporting
Researchers should consult established reporting standards before finalizing their Methods sections.
The following resources provide useful guidance:
- CONSORT 2025 Guidelines: Updated recommendations for reporting randomized trials, including sample size determination and its underlying assumptions.
- STROBE Statement: Reporting guidance for observational studies, including explanations of how study size was determined.
- G*Power Research Publication: The foundational publication describing the G*Power 3 statistical power analysis program.
These guidelines improve transparency, but they do not replace the need to follow the target journal's specific author instructions.
Also read: Addressing Desk Rejection: How to Rewrite Your Abstract in 2026
11. Final Pre-Submission Checklist for Sample Size and Power Analysis
Before uploading your manuscript, complete the following checks:
Statistical methodology
- The primary outcome used for sample size calculation is identified.
- The sample size calculation matches the study design.
- The anticipated effect size is reported and justified.
- The significance level and one- or two-sided testing approach are specified.
- The desired statistical power is documented.
- The statistical test or sample size formula is identified.
Software and numerical reporting
- The software name and version are provided.
- The relevant software publication is cited.
- All calculation parameters are accurately reported.
- Required sample sizes per group and overall are stated.
- Attrition and recruitment adjustments are explained.
Manuscript consistency
- Planned and actual sample sizes are consistent across sections.
- Participant exclusions and withdrawals are documented.
- The final analyzed sample is reported.
- Missing-data procedures are explained.
- Tables, figures, and participant-flow diagrams match the reported numbers.
- Applicable CONSORT, STROBE, or other reporting guidelines have been checked.
Language and formatting
- Statistical terminology is used consistently.
- Mathematical notation is accurate.
- Software references follow the journal's required citation style.
- The Methods section uses precise academic language.
- All numerical values have been independently verified.
Conclusion: Make Your Sample Size Justification Reproducible and Publication-Ready
Reporting sample size and statistical power analysis effectively requires more than stating the number of participants included in a study. Researchers must explain the rationale behind the sample size, identify the statistical assumptions, document the calculation method, and distinguish between prospective planning and retrospective interpretation.
An accurate a priori power calculation strengthens methodological transparency, while appropriate reporting of attrition and final analyzed sample sizes improves reproducibility. Researchers working with limited resources should provide a defensible feasibility or precision-based justification rather than overstating statistical adequacy.
Most importantly, ensure that the sample size justification reflects the actual research design, primary outcome, statistical analysis, and journal reporting requirements.
Give your research manuscript the editorial attention it deserves. PaperEdit's professional academic editing and proofreading services help researchers refine methodological explanations, improve statistical reporting, standardize references, and prepare manuscripts for submission. Visit PaperEdit to strengthen your manuscript before it reaches peer review.