


Statistical reporting is one of the most technically demanding aspects of academic manuscript preparation. Even when researchers conduct sound statistical analyses, mistakes in presenting p-values, effect sizes, confidence intervals, figures, and data availability statements can weaken the credibility of their findings and create unnecessary obstacles during peer review.
Statistical reporting in research papers refers to the systematic presentation, interpretation, and documentation of numerical results so that readers can evaluate the strength, magnitude, precision, and reproducibility of research findings. It requires more than listing test statistics or identifying statistically significant results. Authors must communicate what the data demonstrate, how much uncertainty surrounds the estimates, and whether the reported conclusions are supported by the analysis.
Accurate statistical reporting improves academic transparency, strengthens methodological credibility, and helps editors and reviewers assess whether research conclusions are justified. It also ensures consistency with journal-specific requirements, including APA 7th edition, Chicago, Vancouver, and discipline-specific reporting standards.
This guide explains how to correctly report p-values and effect sizes, present confidence intervals, format statistical symbols, design publication-ready figures, and write a comprehensive data availability statement for journal submission in 2026.
💡 Ready to polish your research paper for publication?
Transform your manuscript with PaperEdit's professional editing and proofreading services!
1. Understanding Statistical Reporting in Academic Research
Statistical reporting translates analytical findings into a structured format that readers can understand, evaluate, and potentially reproduce.
What Should Statistical Reporting Include?
A complete statistical report generally includes:
- Descriptive statistics, such as means, standard deviations, medians, and frequencies.
- Inferential statistics, including t-tests, ANOVA, regression coefficients, and chi-square tests.
- Exact p-values and appropriate significance interpretations.
- Effect sizes that quantify the magnitude of observed differences or relationships.
- Confidence intervals (CIs) that communicate estimation uncertainty.
- Clearly labeled statistical tables and figures.
- Information about missing data, analytical assumptions, and statistical methods.
- A data availability statement explaining access to the underlying research data.
Why Does Accurate Statistical Reporting Matter?
Statistical results support the central arguments of empirical research. If the reported values are incomplete, inconsistent, or incorrectly interpreted, readers cannot reliably assess the validity of the conclusions.
For example, reporting only that an intervention produced a statistically significant improvement does not explain whether the improvement was substantial, clinically meaningful, or practically relevant.
Industry-standard criteria: Authors should provide sufficient methodological and numerical detail for qualified readers to understand the analyses and evaluate the reported findings. The American Statistical Association (ASA) emphasizes responsible statistical practice, transparency, and appropriate interpretation.
Common submission pitfalls:
- Reporting only statistically significant findings.
- Omitting sample sizes and descriptive statistics.
- Presenting results without identifying the statistical tests used.
- Making causal claims from observational data.
- Reporting different numerical values in the abstract, results, and tables.
2. How Do You Correctly Report P-Values and Effect Sizes in a Research Paper?
P-values and effect sizes are complementary statistical measures. While a p-value provides information about the compatibility of observed data with a specified statistical model, an effect size quantifies the magnitude of an observed difference or relationship.
Authors should report both whenever appropriate rather than treating statistical significance as the sole indicator of research importance.
A. Reporting P-Values Correctly
A p-value represents the probability, under a specified null hypothesis and statistical model, of obtaining results at least as extreme as those observed.
It does not represent the probability that the null hypothesis is true.
For example:
Incorrect reporting:
"The intervention was significant (p < 0.05)."
Improved reporting:
"Participants receiving the intervention demonstrated higher mean scores than the control group, t(58) = 2.84, p = .006."
The improved version identifies the statistical test, degrees of freedom, test statistic, and exact probability value.
P-Value Formatting Rules
| Statistical result | Recommended presentation |
| p = 0.032 | p = .032 |
| p = 0.004 | p = .004 |
| p = 0.0004 | p < .001 |
| p = 0.058 | p = .058 |
| p = 0.250 | p = .250 |
Under APA conventions, leading zeros are generally omitted for statistical values that cannot exceed 1, including p-values and correlation coefficients.
Do not report p = .000. Statistical software may display this value because of rounding, but the appropriate manuscript presentation is p < .001.
B. Reporting Effect Sizes
Effect sizes describe how large an observed difference, association, or relationship is.
Common measures include:
- Cohen's d: Standardized difference between two means.
- Pearson's r: Strength and direction of a linear relationship.
- Eta squared (η²): Proportion of variance associated with an effect.
- Partial eta squared (ηp²): Proportion of relevant variance associated with an effect after accounting for other model terms.
- Odds ratio (OR): Relative odds of an outcome between groups.
- Risk ratio (RR): Relative probability of an outcome between groups.
- R²: Proportion of variance explained by a regression model.
For example:
"The intervention produced a moderate standardized difference between groups (Cohen's d = 0.58)."
The interpretation should consider the research context, measurement properties, and relevant literature rather than relying exclusively on universal effect-size thresholds.
Statistical Significance vs. Practical Significance
A statistically significant finding is not automatically important in practical, clinical, or theoretical terms.
A very large sample can produce a small p-value for a negligible effect. Conversely, a potentially important effect may fail to reach conventional statistical significance in an underpowered study.
| Criterion | Statistical significance | Practical significance |
| Main focus | Compatibility with a statistical model under the null hypothesis | Real-world importance of a finding |
| Common indicator | P-value | Effect size and contextual interpretation |
| Sample-size influence | Often substantial | Depends on the research context |
| Interpretation | Evidence against a specified null model | Relevance to theory, practice, or policy |
Industry-standard criteria: Report the relevant test statistic, degrees of freedom where applicable, exact p-value, effect size, and confidence interval. Follow the target journal's preferred decimal and notation conventions.
Common submission pitfalls:
- Treating p < .05 as proof of a hypothesis.
- Omitting effect sizes.
- Describing nonsignificant findings as proof of no effect.
- Using phrases such as "marginally significant" or "approaching significance" without justification.
- Reporting effect-size thresholds without considering disciplinary context.
For further guidance, consult the ASA Statement on Statistical Significance and P-Values.
3. Reporting Confidence Intervals in Research
Confidence intervals provide a range of plausible values for a population parameter under the assumptions of the statistical procedure.
A 95% confidence interval is generated by a method that, under repeated sampling and its assumptions, would contain the true parameter in approximately 95% of repeated intervals.
How to Report Confidence Intervals
A confidence interval should accompany important effect estimates whenever appropriate.
Example:
"The intervention increased test scores by 4.8 points (95% CI [2.1, 7.5])."
This presentation communicates:
- The estimated difference: 4.8 points.
- The lower confidence limit: 2.1.
- The upper confidence limit: 7.5.
- The uncertainty surrounding the estimate.
For ratio measures, such as odds ratios and risk ratios, confidence intervals should be interpreted relative to the null value of 1.
For differences and standardized mean differences, the corresponding null value is generally 0.
Why Confidence Intervals Matter
Confidence intervals help readers evaluate both the magnitude and precision of an estimate. A narrow interval generally indicates greater precision than a wide interval, although interpretation also depends on study design and assumptions.
Industry-standard criteria:
- Specify the confidence level, commonly 95%.
- Include lower and upper confidence limits.
- Use consistent decimal precision.
- Report intervals alongside the corresponding estimates.
- Explain clinically or practically important thresholds where relevant.
Common submission pitfalls:
- Reporting confidence intervals without their associated estimates.
- Confusing standard deviation with standard error.
- Interpreting a 95% confidence interval as a 95% probability that a fixed population parameter lies within the particular observed interval.
- Omitting confidence intervals for important regression or treatment estimates.
4. How to Format Statistical Symbols and Abbreviations in Text
Consistent statistical notation improves readability and helps manuscripts comply with disciplinary style requirements.
APA 7th edition provides specific conventions for presenting statistical symbols, while Chicago and Vancouver publications may follow journal-specific adaptations.
APA 7th Statistical Notation
Common APA conventions include:
| Statistical element | Formatting | Example |
| Sample size | Italic uppercase or lowercase N/n | N = 250; n = 125 |
| Probability value | Italic lowercase p | p = .024 |
| Correlation coefficient | Italic lowercase r | r = .46 |
| t-statistic | Italic lowercase t | t(40) = 2.35 |
| F-statistic | Italic uppercase F | F(2, 57) = 4.62 |
| Mean | Italic uppercase M | M = 18.45 |
| Standard deviation | Italic uppercase SD | SD = 3.21 |
| Degrees of freedom | Italic lowercase df | df = 58 |
APA and Chicago Statistical Reporting Standards
APA and Chicago are both widely used academic style systems, but their statistical presentation requirements should not be assumed to be identical.
APA 7th provides relatively explicit statistical notation conventions, particularly for psychology and social sciences.
Chicago focuses on broader editorial and documentation principles. Statistical notation, numerical precision, and table presentation should also be checked against the relevant discipline and journal instructions.
For example, a medical journal using Chicago-style references may still require statistical formatting based on its own clinical reporting guidelines.
Industry-standard criteria:
- Italicize statistical variables where required.
- Use consistent decimal precision.
- Define nonstandard abbreviations at first mention.
- Distinguish sample sizes from population parameters.
- Maintain consistent notation across text, tables, and figures.
Common submission pitfalls:
- Switching between italicized and nonitalicized statistical symbols.
- Using inconsistent abbreviations.
- Applying APA formatting to a manuscript requiring another journal-specific convention.
- Reporting percentages with inconsistent decimal places.
Also read: Proofreading vs Editing: What’s the Difference and Which Do You Need?
5. Presenting Statistical Figures in a Research Paper
Statistical figures transform numerical findings into visual representations that help readers identify patterns, relationships, distributions, and differences.
However, a poorly designed graph can obscure important findings or create misleading impressions.
Selecting the Right Statistical Figure
Choose visualizations according to the research question and data structure.
| Figure type | Appropriate application | Key consideration |
| Bar chart | Frequencies and categorical comparisons | Use clear category labels |
| Histogram | Distribution of continuous variables | Select appropriate bin widths |
| Box plot | Median, quartiles, and distribution | Identify outliers clearly |
| Scatter plot | Relationships between continuous variables | Show relevant trends |
| Line graph | Changes over time or ordered measurements | Label axes and time points |
| Forest plot | Effect estimates across studies or subgroups | Include confidence intervals |
| Kaplan–Meier plot | Time-to-event analysis | Include numbers at risk |
Presenting Visual Data Figures With Error Bars
Error bars communicate variability or uncertainty around an estimate. However, standard deviation, standard error, and confidence intervals represent different statistical concepts.
- Standard deviation (SD): Describes variability among individual observations.
- Standard error (SE): Describes the sampling variability of an estimated statistic.
- Confidence interval (CI): Provides an interval estimate with a specified coverage procedure.
Always identify which measure the error bars represent in the figure legend.
For example:
"Data are presented as mean values with 95% confidence intervals."
Do not use unlabeled error bars or assume that readers will recognize their meaning.
Technical Specifications for Publication-Ready Figures
Although individual journals have different production requirements, the following are useful preparation targets:
- Resolution: Aim for 300 DPI for photographs and continuous-tone images.
- Line art: Some journals require 600–1200 DPI for sharp reproduction.
- Fonts: Use consistent, legible typography.
- Axes: Include descriptive labels and measurement units.
- Legends: Define colors, symbols, abbreviations, and error bars.
- File formats: Follow journal requirements for TIFF, EPS, PDF, or other accepted formats.
- Accessibility: Use distinguishable colors and patterns, including for readers with color-vision deficiencies.
Statistical Figure Editing Workflow
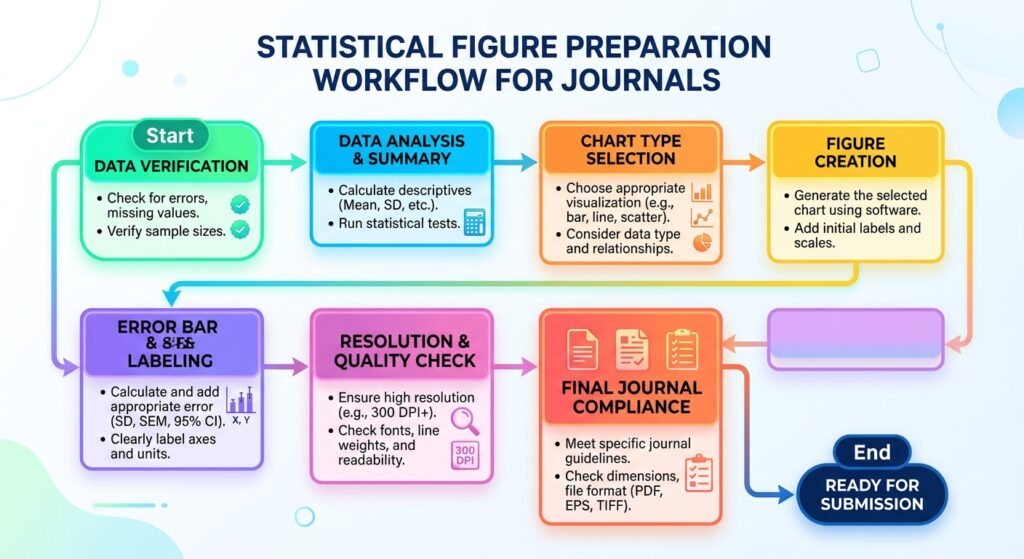
Industry-standard criteria: Figures should be interpretable independently, accurately represent the underlying data, and follow journal specifications for dimensions, resolution, labels, and legends.
Common submission pitfalls:
- Using three-dimensional charts that distort visual comparisons.
- Presenting truncated axes without justification.
- Omitting sample sizes.
- Failing to identify error-bar definitions.
- Repeating identical information in figures and tables.
- Using low-resolution images or inconsistent graphical styles.
Also read: The Unsung Power of Punctuation in Scholarly Writing
6. Writing a Data Availability Statement for Journal Submission
A data availability statement explains whether and how readers can access the data supporting a research publication.
Many journals require this statement to improve research transparency, facilitate verification, and support reproducibility.
What Should Be Included in a Data Availability Statement?
A complete statement should identify:
- Whether the underlying data are publicly available.
- The repository or data platform where the files are deposited.
- A persistent identifier, such as a DOI, where available.
- Any access restrictions.
- The process for requesting restricted data.
- Relevant supplementary datasets, protocols, or supporting materials.
Data Availability Statement Example
Example 1: Publicly available data
"The datasets generated and analyzed during the current study are available in the Zenodo repository at [insert DOI]."
Example 2: Data available upon reasonable request
"The datasets supporting the findings of this study are available from the corresponding author upon reasonable request, subject to applicable institutional and ethical restrictions."
Example 3: Restricted data
"The data supporting this study are not publicly available because they contain potentially identifiable participant information. Qualified researchers may request access through the institutional data access committee, subject to ethical approval and applicable data protection requirements."
Example 4: No new data generated
"No new datasets were generated or analyzed during this study. Data availability is therefore not applicable."
These examples should be adapted to the actual study and journal policy. Authors must never claim that data are available in a repository unless the files have genuinely been deposited and can be accessed.
Journal Requirements and Data Transparency
The International Committee of Medical Journal Editors (ICMJE) has specific data-sharing requirements for clinical trials.
For applicable clinical trial manuscripts, data-sharing statements must address whether individual participant data will be shared, which data and supporting documents are available, when access begins, how long it continues, and the criteria and process for obtaining access.
Other journals may require broader data availability declarations covering research datasets, code, supplementary materials, and repository identifiers.
Industry-standard criteria:
- Use a recognized repository when appropriate.
- Provide working repository links and persistent identifiers.
- Explain restrictions transparently.
- Ensure the statement matches the actual data-sharing arrangements.
- Follow journal-specific and applicable institutional requirements.
Common submission pitfalls:
- Omitting the statement entirely.
- Providing a broken DOI or repository link.
- Using vague language such as "data are available upon request" without explaining access conditions.
- Claiming unrestricted access to confidential participant information.
- Providing inconsistent information across the manuscript and supplementary files.
For current requirements, consult the ICMJE Recommendations and its clinical trial data-sharing guidance.
Also read: PaperEdit Academic Proofreading Services
7. Statistical Reporting Standards Across Major Research Disciplines
Although the fundamental principles of statistical transparency remain consistent, individual disciplines and journals may require additional reporting details.
| Reporting requirement | APA 7th | Chicago | Vancouver / Medical Journals |
| Statistical notation | Explicit conventions | Follow applicable discipline and journal rules | Follow journal-specific conventions |
| P-value presentation | Exact values where appropriate | Journal-dependent | Often exact values with specified rounding |
| Effect sizes | Important for inferential reporting | Discipline-dependent | Strong emphasis on clinically relevant estimates |
| Confidence intervals | Recommended where appropriate | Journal-dependent | Commonly expected for important estimates |
| Figures and tables | Consistent labeling and formatting | Journal-dependent | Detailed figure and table requirements |
| Data transparency | Follow research and journal requirements | Follow journal policy | May include specific data-sharing requirements |
Important: A citation style does not replace a statistical reporting guideline. Authors should distinguish reference formatting from the technical requirements governing research methods and results.
For example, a clinical trial should follow the relevant CONSORT reporting requirements, while an observational study should consider STROBE. Systematic reviews should follow PRISMA where applicable.
Also read: 10 Powerful Tips on Grammatical Errors in Research Paper and Thesis
8. Final Statistical Reporting and Manuscript Editing Checklist
Before submitting a research paper, conduct a systematic audit of every statistical result, figure, table, and supporting statement.
Statistical Accuracy
- Verify all statistical calculations against the original analysis output.
- Confirm that sample sizes and subgroup counts are correct.
- Check that the selected statistical tests are appropriate.
- Report exact p-values where available.
- Include relevant effect sizes and confidence intervals.
- Avoid interpreting statistical significance as proof of practical importance.
- Disclose relevant assumptions, missing-data procedures, and analytical limitations.
Language and Statistical Notation
- Standardize statistical symbols according to the required style.
- Check italicization of statistical variables.
- Define nonstandard abbreviations.
- Maintain consistent decimal precision.
- Correct grammar, punctuation, and academic phrasing.
- Eliminate ambiguous or exaggerated interpretations.
Tables and Figures
- Verify every numerical value against the results section.
- Include descriptive titles and explanatory legends.
- Label axes and measurement units.
- Identify error-bar definitions.
- Check figure resolution and file formats.
- Ensure figures are cited in the manuscript.
- Remove unnecessary duplication between text, tables, and figures.
Data Availability and Journal Compliance
- Include a complete data availability statement.
- Verify repository links and DOIs.
- Explain any ethical or confidentiality restrictions.
- Check applicable reporting guidelines.
- Confirm compliance with the target journal's author instructions.
- Review the abstract, main text, tables, and supplementary materials for consistency.
Conclusion: Make Statistical Reporting Clear, Accurate, and Publication-Ready
Effective statistical reporting is essential to credible academic research. Authors must communicate more than whether a result is statistically significant. They must present meaningful effect estimates, confidence intervals, clearly formatted statistical notation, accurate figures, and transparent data availability information.
By following recognized reporting standards, checking numerical consistency, and applying careful academic editing, researchers can strengthen their manuscripts and make their findings easier for editors, reviewers, and readers to evaluate.
However, even technically correct statistical results can lose their impact when language, formatting, or presentation is inconsistent. A final professional review helps eliminate these avoidable weaknesses before submission.
Prepare your manuscript for its next publication milestone with PaperEdit. Explore PaperEdit's professional academic editing and proofreading services to refine statistical presentation, improve academic clarity, standardize manuscript formatting, and ensure your research communicates its findings with precision and confidence.