


Presenting qualitative interview data in tables requires more than placing participant quotations into rows and columns. A well-designed qualitative results table should make the relationship between codes, categories, themes, supporting evidence, and interpretation immediately visible without replacing the narrative analysis.
For doctoral dissertations, theses, journal articles, and qualitative research reports, the central challenge is deciding what belongs in a table and what belongs in narrative text. Overloading a table with transcript excerpts can obscure the argument, while providing only isolated quotations can make the analysis appear descriptive rather than analytical.
This guide explains how to format qualitative interview quotes in a table, construct a thematic analysis matrix for Chapter 4, decide when qualitative data should be presented in a table versus narrative text, organize interview quotations, and prepare tables that meet academic publishing and manuscript-formatting expectations.
💡 Ready to polish your research paper for publication?
Transform your manuscript with PaperEdit's professional editing and proofreading services.
What Is a Qualitative Interview Data Table?
A qualitative interview data table is a structured visual representation of selected evidence from interview transcripts. Depending on the research design, it may organize participants, codes, categories, themes, representative quotations, interpretations, or analytic memos.
The table should answer a specific analytical question. It is not intended to reproduce the transcript.
For example, a thematic analysis table might use this structure:
| Theme | Subtheme | Code | Representative quotation | Interpretation |
| Institutional support | Access to resources | Limited funding | “We often had to find alternatives when resources were unavailable.” (P04) | Participants described resource limitations as a barrier to implementation. |
| Institutional support | Leadership involvement | Administrative support | “When our director became involved, the process moved much faster.” (P07) | Visible leadership participation was associated with greater implementation momentum. |
| Professional adaptation | Learning through practice | Informal learning | “Most of what I learned came from trying it myself.” (P02) | Participants emphasized experiential learning over formal training. |
The exact structure should reflect your research questions, methodological approach, coding framework, and target journal's author guidelines.
Why use tables?
Tables can help readers:
- Compare themes and subthemes systematically.
- Locate representative participant quotations quickly.
- Understand how codes were consolidated into broader categories.
- See the connection between raw data and interpretation.
- Reduce repetitive explanations in the results section.
- Audit the transparency of the analytical process.
- Navigate lengthy qualitative findings in a dissertation or thesis.
However, a table should support the analytical narrative rather than duplicate it. General table guidance from APA emphasizes that tables should improve communication, be necessary, and be understandable independently of the surrounding text. The International Committee of Medical Journal Editors (ICMJE) similarly recommends limiting tables to material needed to explain the argument and assess the evidence.
How Do You Format Qualitative Interview Quotes in a Table?
Begin by selecting quotations that are representative, analytically relevant, and sufficiently concise.
Do not automatically insert the longest or most emotionally compelling quotations into your table. A quotation earns a place in the table when it provides evidence for the theme or interpretation being presented.
1. Identify the analytical level
Decide whether your table is showing:
- Raw interview data
- Initial codes
- Focused codes
- Categories
- Subthemes
- Overarching themes
- Representative quotations
- Interpretive findings
Avoid mixing analytical levels without labeling them clearly.
For example, a table titled “Selected Participant Quotations” should not unexpectedly contain a complex coding framework unless the table headings make that relationship explicit.
2. Use consistent participant identifiers
Use anonymized identifiers such as:
- P01
- P02
- P03
- Interviewee 04
- Participant A
Choose one system and use it consistently.
Do not include names, job titles, locations, or demographic details that could inadvertently identify participants. If contextual information is necessary, explain your anonymization procedure in the Methods section or table note.
3. Preserve the meaning of quotations
Do not rewrite participant quotations simply to make them sound grammatically correct.
Qualitative quotations represent participant voice and therefore require particular care. If transcription conventions permit minor edits for readability, document the approach in the methodology and apply it consistently.
Use ellipses only when they accurately indicate omitted material. Use brackets when inserting explanatory material or grammatical clarification, according to the relevant style requirements.
4. Keep quotations focused
A table is rarely the best location for an entire paragraph-long interview response.
Instead, select a concise excerpt that demonstrates the relevant point.
Less effective:
[A lengthy transcript passage containing several ideas, repetitions, pauses, and unrelated details.]
More effective:
“I had access to the training, but I did not have enough time to apply what I learned.” (P06)
The second quotation provides focused evidence for a theme concerning implementation barriers.
5. Explain the identifier system
A table note can clarify the notation used:
Note. P01–P12 represent anonymized interview participants. Quotations have been lightly edited for readability without altering substantive meaning.
Only include such a statement if it accurately reflects your transcription and editing procedure.
When Should Qualitative Data Be Presented in a Table Versus Narrative Text?
The decision depends on what the reader needs to understand.
Use a table when readers need to compare multiple pieces of information systematically. Use narrative text when readers need to understand the context, sequence, interpretation, or significance of a finding.
| Presentation method | Use it when | Typical content | Common pitfall |
| Narrative text | Context and interpretation are central | Theme explanation, relationships, contrasts, researcher interpretation | Repeating every quotation without analysis |
| Quote table | Multiple quotations need comparison | Theme, participant ID, representative quote | Turning the table into a transcript |
| Coding matrix | Analytical progression needs to be demonstrated | Codes, categories, subthemes, themes | Including every initial code |
| Participant summary table | Sample characteristics need clarification | Participant group, relevant characteristics, interview details | Including identifying information |
| Theme matrix | Findings span several research questions | Research question, theme, subtheme, evidence | Creating a table so large it becomes unreadable |
| Supplementary table | Detailed evidence exceeds the main article | Extended quotations, coding detail, audit material | Moving essential findings out of the main paper |
The key principle is division of labor: let the table organize evidence and let the narrative explain its meaning.
For example:
Participants consistently described limited preparation time as an obstacle to implementation (Table 3). This constraint was not limited to formal training; several participants explained that competing responsibilities reduced their ability to apply newly acquired practices. P06 summarized this tension by stating, “I had access to the training, but I did not have enough time to apply what I learned.”
The table provides the evidence structure. The paragraph provides interpretation.
Avoid duplicating the table in prose
A common submission problem is writing the entire table again in paragraph form.
Instead of listing every theme, quotation, and participant in the narrative, identify the most important analytical finding and explain its significance.
Current ICMJE guidance likewise advises authors not to repeat all information from tables in the text; the narrative should emphasize the principal observations.
Also read: Top 10 APA 7th Formatting Errors That Cause Journal Rejections and How to Fix Them
What Should a Thematic Analysis Matrix Look Like in Chapter 4?
For a dissertation or thesis, Chapter 4 often requires a more explicit connection between the research questions and qualitative findings.
A useful thematic analysis matrix might look like this:
Table 1. Thematic Analysis Matrix for Interview Findings
| Research question | Theme | Subtheme | Representative codes | Illustrative evidence |
| RQ1 | Access to institutional support | Resource availability | Funding; equipment; staffing | P03, P06, P09 |
| RQ1 | Access to institutional support | Leadership support | Advocacy; supervision; decision-making | P02, P05, P08 |
| RQ2 | Professional adaptation | Experiential learning | Trial and error; peer learning | P01, P04, P07 |
| RQ2 | Professional adaptation | Confidence development | Skill acquisition; feedback; reflection | P03, P07, P10 |
This format gives the reader an overview of the analytical architecture.
However, do not assume that every dissertation requires exactly this matrix. Your methodology may call for a different structure. A reflexive thematic analysis, grounded theory study, phenomenological inquiry, case study, or content analysis may organize evidence differently.
The matrix should reflect your actual analysis
Do not manufacture a neat hierarchy merely because it looks visually appealing.
If your analysis moved from codes directly to themes, do not create artificial “categories” solely to fill a table column. Likewise, if themes were developed iteratively, avoid presenting the process as a rigid linear sequence unless that accurately describes your methodology.
The table must remain methodologically defensible.
How to Summarize Interview Transcripts in Tables
A transcript summary should capture analytical meaning, not simply shorten what participants said.
A practical workflow is:
Transcript → Initial coding → Code consolidation → Category development → Theme development → Representative evidence → Interpretive synthesis
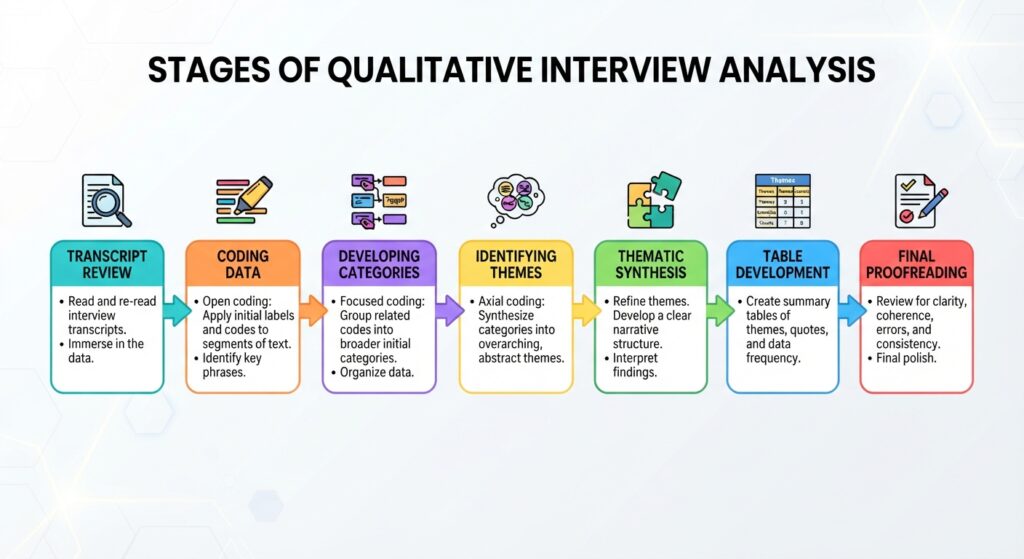
For each interview, ask:
- What issue does the participant address?
- Which code captures that issue?
- Does the code contribute to a broader category?
- Does the category support an established theme?
- Is the quotation representative of that theme?
- What does the evidence demonstrate in relation to the research question?
This prevents a frequent qualitative-writing problem: confusing summary with analysis.
For example:
Summary:
“Participants discussed problems with workload.”
Analysis:
“Participants described workload not merely as a logistical constraint but as a factor that limited their capacity to implement newly acquired practices.”
The second statement makes an analytical claim and can then be supported by carefully selected quotations.
Coding Framework Table Template for Interviews
A coding framework table can be particularly useful during analysis and thesis preparation.
| Code | Operational definition | Inclusion criteria | Exclusion criteria | Example quotation |
| Resource constraint | References to insufficient material or financial resources | Mentions of funding, equipment, staffing, or materials | General dissatisfaction without a resource component | “We often had to find alternatives when resources were unavailable.” |
| Leadership support | References to managerial or institutional assistance | Advocacy, supervision, authorization, or leadership participation | Peer support without leadership involvement | “When our director became involved, the process moved much faster.” |
| Informal learning | Learning acquired outside formal training | Peer learning, experimentation, observation, self-directed learning | Structured courses or mandatory workshops | “Most of what I learned came from trying it myself.” |
This type of table is primarily an analytic tool. It does not necessarily belong in the final journal article.
For a dissertation, selected elements may appear in Chapter 3 to explain the analytical procedure or in an appendix to document the coding framework. The final Chapter 4 should generally prioritize the findings that answer the research questions.
Also read: Structuring Chapter 4: Results & Findings Explained 2026 Dissertation Guide
Best Practices for Qualitative Data Presentation
Make every table self-explanatory
A reader should be able to understand the table without repeatedly searching the surrounding text.
Include:
- A clear table number.
- A concise, descriptive title.
- Informative column headings.
- Participant identifier definitions where necessary.
- Explanatory notes for abbreviations or symbols.
- A source note when applicable.
APA-style table guidance recommends sequential numbering, concise titles, clear headings, explanatory notes where necessary, and restrained use of borders. APA guidance also recommends avoiding unnecessary vertical rules.
Maintain terminology consistency
If your manuscript uses “Theme 1: Institutional Support,” do not alternate between:
- Institutional support
- Institutional Support
- Organizational support
- Institutional assistance
unless these terms represent genuinely different concepts.
Consistency should extend across:
- Tables
- Headings
- Narrative text
- Figures
- Appendices
- Coding documentation
Avoid decorative formatting
Qualitative tables often become difficult to read when authors use excessive shading, merged cells, multiple font types, or elaborate borders.
Prioritize:
- Clear hierarchy
- Adequate white space
- Short headings
- Consistent alignment
- Legible quotations
- Minimal visual clutter
Follow the target journal's table specifications if they differ from a general style guide.
Use quotations strategically
A strong qualitative results section does not attempt to prove a theme by quotation volume.
Three short, analytically distinct quotations may be more informative than ten repetitive quotations.
Select excerpts that demonstrate:
- Convergence
- Divergence
- Contradiction
- Variation across participant groups
- Particularly clear articulation of a theme
- Unexpected or theoretically important findings
Where contrasting perspectives matter, preserve that contrast rather than selecting quotations that create an artificially uniform finding.
Also read: Complete Master’s & PhD Dissertation Defense & Formatting Checklist: 2026 Guide
Presenting Qualitative Data in Dissertation Tables
Dissertations frequently allow greater detail than journal articles. You can therefore use multiple table types at different stages.
Chapter 3: Methodology
Potential tables include:
- Participant characteristics
- Interview protocol overview
- Coding framework
- Analytical procedures
- Trustworthiness strategies
Chapter 4: Findings
Potential tables include:
- Research-question-to-theme matrix
- Themes and subthemes
- Representative quotations
- Cross-case comparison
- Theme-by-participant matrix
Appendices
Potential supporting material includes:
- Extended coding frameworks
- Interview question schedules
- Expanded evidence matrices
- Additional representative quotations
- Audit documentation, where appropriate
Do not automatically place important findings in an appendix simply because the table is long. If readers need the information to understand your central argument, it may belong in the main findings section.
Qualitative Data Layout Guidelines for Journal Submission
Journal requirements take precedence over generic formatting advice.
Before submission, inspect the journal's Instructions for Authors for:
- Maximum table count
- Table file requirements
- Placement instructions
- Supplementary-material policies
- Table title conventions
- Citation and reference style
- Anonymization requirements
- Word limits
- Reporting guidelines
- File-format requirements
For health and medical research involving interviews or focus groups, consider whether COREQ (Consolidated Criteria for Reporting Qualitative Research) applies to your study. COREQ is a 32-item reporting checklist designed specifically for qualitative interviews and focus groups and addresses reporting across the research report, not simply table formatting.
For other qualitative designs, identify the reporting guideline appropriate to your methodology rather than applying COREQ automatically.
Common Submission Pitfalls
1. Treating tables as transcript repositories
A table containing dozens of long quotations is difficult to interpret and can overwhelm the central argument.
Fix: Select representative evidence and move detailed supporting material to supplementary files or appendices when appropriate.
2. Providing quotations without interpretation
A quotation is evidence, not automatically an analysis.
Fix: Explain what the quotation demonstrates and how it relates to the research question and theme.
3. Using inconsistent participant labels
Switching between “Participant 1,” “P1,” and “Interviewee A” creates uncertainty.
Fix: Establish one anonymization system and apply it throughout the manuscript.
4. Revealing participant identities
Small samples can make participants identifiable even when names are removed.
Fix: Review combinations of demographic, occupational, geographic, and contextual information for re-identification risk.
5. Overclaiming from quotation frequency
Counting quotations does not automatically establish thematic importance.
Fix: Explain the analytical basis for theme development and describe variation or negative cases where relevant.
6. Duplicating tables and narrative
Repeating every table entry in prose makes the manuscript unnecessarily long.
Fix: Use prose for interpretation and tables for structured evidence.
7. Ignoring journal specifications
A table can be academically sound and still require revision before submission.
Fix: Audit the target journal's current formatting instructions immediately before uploading the manuscript.
Final Pre-Submission Checklist for Qualitative Interview Tables
Before submitting your dissertation, thesis, or journal manuscript, complete this audit:
- Every table has a clear purpose.
- Every table is cited in the main text.
- Tables appear in the required order.
- Table titles accurately describe their content.
- Column headings are concise and parallel.
- Participant identifiers are consistent and anonymized.
- Quotations accurately represent the transcript and your stated transcription policy.
- Ellipses and brackets are used consistently.
- Quotations provide evidence rather than replacing analysis.
- Themes and subthemes correspond to the methodology.
- Codes have not been presented as themes without analytical justification.
- Contradictory or divergent evidence has not been selectively omitted.
- Tables do not unnecessarily duplicate the narrative.
- Abbreviations and symbols are explained.
- Formatting follows the required style guide, such as APA 7th, where applicable.
- Table borders and spacing meet the target publication's requirements.
- Sensitive participant information has been reviewed for disclosure risk.
- Supplementary tables have been separated from essential findings where appropriate.
- Reporting requirements such as COREQ have been checked when applicable.
- Cross-references to tables are accurate after final revisions.
- The manuscript has undergone a final academic proofreading and consistency check.
Conclusion
Presenting qualitative interview data in tables is fundamentally an exercise in analytical communication. The goal is not to fit as much transcript material as possible into a visual format. The goal is to help readers see how evidence supports your codes, themes, and interpretations while preserving the context and complexity of participant experiences.
For a strong qualitative manuscript, select evidence strategically, label analytical levels clearly, preserve participant meaning, distinguish tables from narrative interpretation, and follow the target journal's formatting and reporting requirements. A carefully edited thematic matrix or quotation table can make a complex qualitative analysis substantially easier to evaluate.
Before submission, conduct a final structural, language, formatting, and consistency audit. PaperEdit's academic editing and proofreading support can help researchers refine qualitative results tables, standardize manuscript formatting, and prepare research papers for journal submission.