


Tables and figures often carry the most important evidence in a dissertation or research manuscript, yet they are also among the most frequently misformatted elements. A table may contain correct statistics but still require revision because its title, notes, headings, borders, or placement do not follow APA 7th edition conventions. A figure may communicate a complex finding effectively but lose clarity because of inadequate labels, poor resolution, inconsistent typography, or missing attribution.
APA 7th edition table and figure formatting provides a standardized system for presenting quantitative and qualitative information clearly. For doctoral students, however, APA compliance is only one layer of the process. University dissertation manuals, graduate-school templates, publisher instructions, and journal author guidelines may impose additional requirements.
This guide explains how to format tables in APA 7th edition and how to format figures in APA 7th edition, including numbering, titles, notes, placement, typography, source attribution, accessibility, and final quality control.
💡 Ready to polish your research paper for publication?
Transform your manuscript with PaperEdit's professional editing and proofreading services!
Why APA 7 Table and Figure Formatting Matters
Tables and figures are not decorative additions to academic writing. They are evidence-delivery mechanisms.
A well-designed table allows readers to compare values rapidly. A well-designed figure can reveal patterns, relationships, distributions, or processes that would require several paragraphs of prose to explain.
APA formatting supports three goals:
- Consistency: Readers encounter predictable numbering, labels, titles, and notes.
- Interpretability: Statistical or conceptual information can be understood without unnecessary searching.
- Publication readiness: Correct formatting reduces technical revisions during dissertation review, peer review, and production.
APA 7 also distinguishes tables from figures according to how information is presented. Tables generally organize information in rows and columns, whereas figures encompass visual presentations such as graphs, charts, diagrams, drawings, photographs, maps, and other visual materials.
For doctoral students, the practical rule is straightforward:
Format the visual according to APA 7, then verify whether your institution or target journal imposes additional requirements.
Also read: Verb Tenses in Research Papers: Which Tense to Use in Each Section
1. Decide Whether You Need a Table or Figure
Before formatting anything, determine whether the information actually benefits from visual presentation.
Use a table when readers need to compare exact values
Tables are particularly effective for:
- Demographic characteristics
- Statistical results
- Descriptive statistics
- Regression coefficients
- Correlation matrices
- Experimental conditions
- Coding categories
- Comparative findings
- Literature-review characteristics
For example, if your dissertation compares age, GPA, income, and years of professional experience across three groups, a table allows readers to compare the values directly.
Use a figure when readers need to see a pattern or relationship
Figures are appropriate for:
- Bar charts
- Line graphs
- Scatterplots
- Flowcharts
- Conceptual models
- Photographs
- Maps
- Diagrams
- Experimental workflows
Do not convert every numerical result into a graph. If the exact numbers matter more than the visual trend, a table may be more efficient.
Industry-standard criterion
Every visual should answer a specific reader need.
Ask:
What does this table or figure communicate that the surrounding prose cannot communicate as efficiently?
If the answer is “nothing,” remove it.
Common pitfall
Avoid duplicating the same information in prose, a table, and a figure. Redundancy increases manuscript length without necessarily improving comprehension.
2. Number Tables and Figures Sequentially
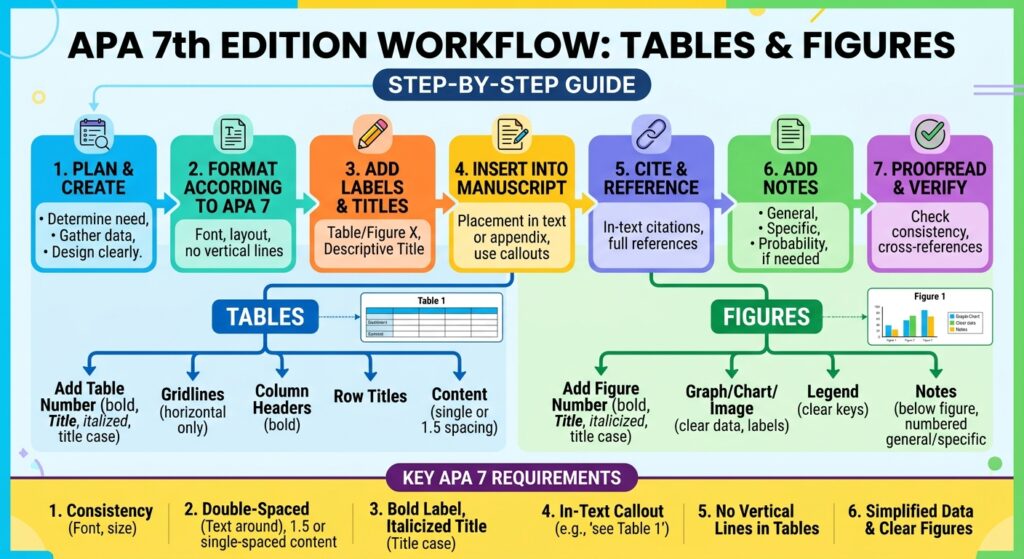
APA 7 requires tables and figures to be numbered in the order in which they are first mentioned in the text.
Use separate numbering sequences:
- Table 1
- Table 2
- Table 3
and:
- Figure 1
- Figure 2
- Figure 3
Do not number them according to the chapter unless your university specifically requires a chapter-based system.
For example:
Table 1 presents the demographic characteristics of the participants.
Later:
Figure 1 illustrates the proposed conceptual framework.
What to avoid
Do not write:
“See the table below.”
Instead, identify the table or figure by number:
“See Table 2.”
This remains useful even when the document is reformatted or the visual moves to another page.
Common submission pitfall
A frequent dissertation error occurs when students insert a new table near the beginning of a chapter but forget to renumber subsequent tables. Conduct a final sequential-number audit after all content revisions are complete.
3. How to Format Tables in APA 7th Edition
The basic APA 7 table structure is:
Table number
Table title
Column headings
Data
Table notes, when applicable
APA tables should be designed for clarity rather than visual decoration. Heavy borders, excessive shading, three-dimensional effects, and unnecessary formatting can reduce readability.
Table number
Place the table number above the table and use bold formatting.
Example:
Table 1
Table title
Place the title directly below the table number.
The title should be concise but sufficiently descriptive to allow readers to understand the table's subject without searching extensively through the manuscript.
APA-style titles are generally written in italic title case.
Example:
Table 1
Participant Demographic Characteristics by Study Group
The title should identify what the table contains, not merely repeat the word “Results.”
Weak:
Results
Stronger:
Mean Academic Self-Efficacy Scores by Intervention Group
Table body
Organize the data into logical rows and columns.
Use consistent decimal places where appropriate. For example, if three columns contain means, reporting 4.2, 5.17, and 6.003 creates unnecessary visual inconsistency.
Instead, determine an appropriate precision level based on the statistical context:
| Measure | Preferred presentation |
| Mean | 4.21 |
| Standard deviation | 0.83 |
| Correlation | .42 |
| p value | < .001 |
| Percentage | 42.6% |
The exact precision should reflect the analytical method and field conventions rather than an arbitrary universal rule.
Table borders
APA tables generally use limited horizontal rules to establish structure rather than enclosing every cell in a box.
Avoid turning a scholarly table into a spreadsheet-style grid.
Do not automatically add:
- Vertical lines between every column
- Heavy outer borders
- Decorative shading
- Multiple colors
- Three-dimensional effects
The objective is rapid interpretation.
4. Use Table Notes Correctly
Notes provide information necessary to understand the table that does not belong naturally in the title or table body.
APA 7 uses three categories of notes:
General notes
General notes explain abbreviations, symbols, overall methodological information, or other information applying to the table as a whole.
Example:
Note. SD = standard deviation. Higher scores indicate greater academic self-efficacy.
Specific notes
Specific notes refer to a particular row, column, cell, or value. They are generally identified using superscript lowercase letters.
Example:
a Significant at p < .05.
Probability notes
Probability notes explain statistical significance levels.
For example:
Note. p < .05. p < .01. p < .001.
Follow the conventions appropriate to your statistical reporting and discipline.
Why notes matter
A table should ideally be interpretable without forcing readers to search through several pages of prose.
However, avoid turning the note into a second Methods section. Include only information necessary to interpret the table.
Also read: Professional APA 7th Edition Table Formatting Service
5. How to Format Figures in APA 7th Edition
Figures follow a similar identification system but use a different visual structure.
The basic sequence is:
Figure number
Figure title
Visual
Figure note, if necessary
For example:
Figure 1
Conceptual Model of Doctoral Student Research Engagement
[Visual]
Note. Arrows indicate hypothesized relationships between study variables.
Figure number
Place the figure number above the figure and use bold formatting.
Number figures independently from tables.
Figure title
Place the figure title directly below the figure number and above the visual.
The title should identify the figure's content without becoming unnecessarily long.
Avoid titles such as:
Figure Showing Results
Prefer:
Figure 2. Relationship Between Weekly Writing Time and Dissertation Progress
The title should function as a concise descriptor.
6. Optimize Figure Design for Academic Readability
A technically correct figure can still be academically ineffective.
When preparing figures, audit:
- Font readability
- Axis labels
- Units
- Legend clarity
- Data labels
- Scale
- Contrast
- Line thickness
- Symbol differentiation
- Image quality
- Caption/title consistency
Use readable typography
APA 7 permits several fonts rather than requiring one universal font. Common APA-compatible choices include fonts such as Times New Roman, Arial, Calibri, and Georgia, subject to the relevant APA and institutional requirements. Purdue OWL's current APA guidance likewise notes that APA papers can use a range of legible 10- to 12-point fonts.
For figures, prioritize legibility after the figure is placed at its final size.
Do not create a graph with tiny axis labels and assume readers will enlarge it.
Maintain consistent visual language
If Figure 1 uses one font and Figure 2 uses another, the dissertation can appear assembled from unrelated sources.
Standardize:
- Typeface
- Font size
- Abbreviation conventions
- Axis formatting
- Decimal precision
- Statistical notation
- Legend style
This is particularly important in dissertations containing figures created in different software packages.
7. Apply APA 7 Formatting to Statistical Tables
Doctoral dissertations frequently contain statistical tables that require more than simple formatting.
For regression tables, ANOVA tables, correlation matrices, or descriptive-statistics tables, standardize:
- Statistical symbols
- Decimal places
- Confidence intervals
- Standard errors
- Sample sizes
- Significance indicators
- Abbreviations
- Notes
APA statistical conventions generally italicize statistical symbols such as M, SD, p, and r when used as statistical symbols.
Do not mix formats such as:
Mean = 4.20, SD = 0.80
with:
M = 4.2, SD = .8
unless there is a deliberate reason.
Choose precision deliberately
For many social-science statistical results, two decimal places are common, but precision should be appropriate to the statistic and discipline.
For example:
M = 4.21, SD = 0.83
is generally more useful than:
M = 4.213847, SD = 0.827391
Excessive decimal places create false precision and visual clutter.
Report uncertainty
Where applicable, include confidence intervals and effect sizes rather than relying exclusively on statistical significance.
A table should help readers assess the magnitude and precision of an effect, not merely whether a threshold was crossed.
8. Place Tables and Figures Where Readers Need Them
APA manuscripts can use different placement approaches depending on whether they are prepared as student papers, manuscripts for publication, or according to institutional dissertation requirements.
Do not assume that one placement rule applies to every submission.
For a doctoral dissertation, check the graduate school's formatting manual first. Some institutions require tables and figures embedded within chapters; others require them at the end of chapters or in separate sections.
For journal submission, follow the target journal's author instructions even when they differ from a general APA convention.
Always introduce the visual in the text
Do not insert a table or figure without explaining its relevance.
Weak:
[Table]
Stronger:
“Table 3 summarizes the descriptive statistics for the four study variables.”
The prose should tell readers why they should look at the visual.
Do not repeat every value
If Table 3 contains 20 values, the paragraph should not reproduce all 20 values.
Instead, highlight the principal finding:
“As shown in Table 3, the intervention group demonstrated higher mean scores than the control group across all three outcome measures.”
This preserves the table's function.
9. Format Captions, Sources, and Adapted Material Carefully
Not every visual is entirely original.
If you reproduce, adapt, or otherwise incorporate copyrighted material, determine whether attribution, permission, or both are required.
A source note can identify the origin of material.
For example:
Note. From Title of Work, by A. Author, 2025, Publisher. Copyright 2025 by Publisher.
The exact attribution format depends on the source and whether the material is reproduced or adapted.
Do not assume that adding a reference-list citation automatically grants permission to reproduce copyrighted material.
For doctoral dissertations, also check your institution's intellectual-property and thesis-submission policies.
Common pitfall
Students frequently download an image from a website, add a citation underneath it, and assume the issue is resolved. Copyright status and permission requirements are separate from citation requirements.
10. Build a Dissertation-Ready List of Tables and Figures
A list of tables and figures in an APA 7 dissertation is usually governed by institutional formatting rules rather than APA alone.
If your graduate school requires a List of Tables or List of Figures, make sure:
- Every listed item appears in the document.
- Numbers match exactly.
- Titles match the actual table/figure titles.
- Page numbers are accurate.
- Heading levels follow institutional requirements.
- Updates are performed after the final layout is locked.
Do not manually type page numbers too early.
Use your word processor's automated table-of-contents or caption functionality where possible, then perform a manual quality-control check before submission.
APA 7 vs. dissertation requirements
| Element | APA 7 principle | Dissertation consideration |
| Table numbering | Sequential table numbers | Institution may require chapter-based numbering |
| Figure numbering | Sequential figure numbers | Verify graduate-school template |
| Titles | Concise, descriptive titles | May need exact formatting in List of Tables/Figures |
| Fonts | Multiple legible options are permitted | University may mandate a specific font |
| Margins | APA provides general paper guidance | Dissertation office may impose stricter margins |
| Placement | Follow manuscript context and APA guidance | Institution may require embedded or end-matter placement |
| Notes | General, specific, and probability notes | Check thesis template for spacing/format |
| Copyright | Cite and attribute sources appropriately | Permission documentation may be required |
| Accessibility | Clear labels and readable design | Institution or publisher may impose additional standards |
Purdue OWL's current APA 7 materials emphasize 1-inch margins and double spacing for general APA papers, but dissertation specifications can differ.
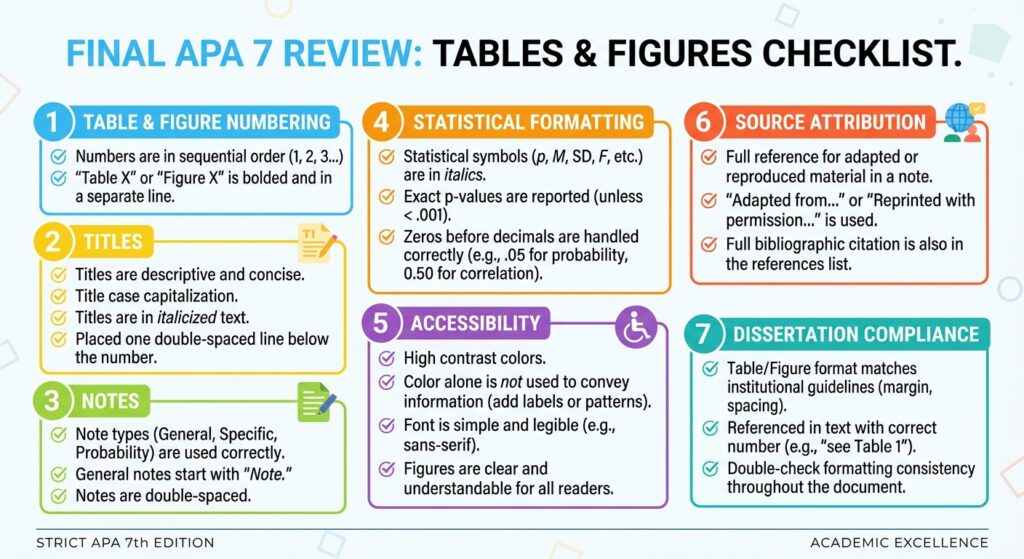
11. Run a Final APA 7 Tables and Figures Checklist
Before submitting your dissertation or manuscript, audit every visual independently.
Numbering
- Tables are numbered sequentially.
- Figures are numbered sequentially.
- Numbering follows first mention in the text.
- No numbers are duplicated or skipped.
Titles
- Every table has a descriptive title.
- Every figure has a descriptive title.
- Titles are consistent with the List of Tables/Figures.
- Titles do not contain unnecessary methodological detail.
Table formatting
- Column headings are clear.
- Units are identified.
- Decimal places are consistent.
- Statistical symbols follow APA conventions.
- Unnecessary vertical rules have been removed.
- Notes are used where clarification is required.
- Abbreviations are defined.
Figure formatting
- Axis labels are readable.
- Units are provided where needed.
- Legends are unambiguous.
- Fonts are consistent across figures.
- Visual elements remain legible at final size.
- Graph scales do not distort interpretation.
- Color is not the only mechanism for distinguishing categories.
Cross-document consistency
- Every table and figure is mentioned in the main text.
- Every mentioned table and figure actually exists.
- Values match the Results section.
- Statistical values match the underlying analysis.
- References to tables and figures use the correct numbers.
- The List of Tables and List of Figures are current.
- Journal or university-specific requirements have been checked
When Professional APA Formatting Support Is Worth Using
APA formatting becomes particularly demanding when a dissertation contains dozens of statistical tables, figures, appendices, references, and cross-references.
Professional academic manuscript editing for doctoral students can address problems that ordinary spell-checking will not detect.
A specialist review can include:
- APA 7 formatting
- Table and figure consistency
- Statistical notation
- Citation and reference auditing
- Figure-label consistency
- Cross-reference checking
- Academic language editing
- ESL language polishing
- Dissertation formatting
- Final manuscript proofreading
PaperEdit Academic Proofreading Services can provide a final technical review when you need a manuscript that is not merely grammatically correct but structurally and stylistically consistent.
Final Takeaway
Correct APA 7 table and figure formatting is ultimately an exercise in reader-centered scholarly communication. Number every visual systematically. Write titles that identify the content. Remove unnecessary visual decoration. Standardize statistical notation and precision. Define abbreviations and symbols in notes. Attribute adapted or reproduced material appropriately. Then verify every element against your university's dissertation manual or target journal's instructions.
Use APA 7 as the baseline not as the only rule.
The final standard is simple: a reader should be able to identify, interpret, and cross-reference every table and figure without unnecessary effort.
Before uploading your dissertation or manuscript, conduct one final formatting audit after all substantive revisions are complete. For a detailed final review, PaperEdit's dissertation proofreading and APA formatting services can help identify inconsistencies that are easy to miss during self-editing.